
The following list contains all features which can be measured within NIS-Elements Measurements. There are the following. Different measurement tools measure different features. If not stated otherwise, all distances and areas are measured in the current (image) calibration units. If the image is not calibrated, pixels are used instead.
Regardless of measurement type.
Accel. N , Accel. T , Acceleration , AcqTime , Angle , Area , Axis A , Axis A/B, Axis B, Bin ID, BinaryArea , BinaryAreaFraction , Blue , BoundsAbsBottom , BoundsAbsLeft , BoundsAbsRight , BoundsAbsTop , BoundsBottom , BoundsLeft , BoundsPxBottom , BoundsPxLeft , BoundsPxRight , BoundsPxTop , BoundsRight , BoundsTop , BrightVariation , CentreX , CentreXabs , CentreXpx , CentreY , CentreYabs , CentreYpx , Centroid, Centroid Abs, Centroid Px, Channel , Circularity , Comment , Convexity , DensityVariation , Diameter , Diff Coeff , Diff Coeff R2 , Duration , Edf Ra , Edf Rz , Edf_Sa, Edf_Sz, EdfRoughness , EdfSurface , Elevation , Elongation , EqDiameter , FieldID , FileName , FillArea , FillRatio , Generation , Green , Heading , Height , HueTypical , HueVariation , ID, Incircle Diameter, IntensityVariation , Length , Length xy, Length xyz , Line Speed , LineLength , Major Axis Length, Mander's Coefficient, MaxFeret , MaxFeret90, MaxIntensity , Mean Sq. Displacement , Mean*ChannelName* , MeanBlue , MeanBrightness , MeanCa2+ , MeanChord , MeanCorrFRET, MeanDensity , MeanFRETEff, MeanGreen , MeanIntensity , MeanRatio , MeanRed , MeanSaturation , MeanTitration , MeasuredArea , Min Rect Area, MinDistance , MinDistanceTo , MinFeret , MinIntensity , Minor Axis Length , Minor2 Axis Length , ND.M, ND.T, NearestObjDist , No.Segments , NumberObjects , NumberObjectsRestricted , Numbers , Obj ID , Object Area, Object Pixel Count, ObjectAreaFraction , Orientation , OuterPerimeter , Path Length , Path Speed , Pearson Coefficient, Perimeter , PerimeterContour , Pitch , Position X, Position Y, Position Z, Radius , Ratio, Rectangularity, Red , Ref Line Length , Ref Object Line Length , RefDistance , Roi ID , ROIArea , Roughness , RoughnessInf , Seg. Length , ShapeFactor , Source , Speed , Sphericity , StartX, StartXpx, StartY, StartYpx, StgPosX, StgPosY, Straightness , Sum*ChannelName* , SumBrightness , SumDensity , SumIntensity , Surface , SurfVolumeRatio , Time , TrackID , TreeID , Type , Velocity , Volume , Volume Center, Volume Center Abs, Volume Center Px, VolumeEqCylinder , VolumeEqSphere , Voxel Count, Width , X, Y, Z
- available in manual measurement.
Angle , Area , Axis A , Axis A/B, Axis B, Blue , CentreX , CentreY , Channel , Comment , Diameter , Edf Ra , Edf Rz , Edf_Sa, Edf_Sz, EdfRoughness , EdfSurface , EqDiameter , Green , Height , Length , Length xy, Length xyz , MaxFeret , MaxFeret90, MaxIntensity , MeanBrightness , MeanDensity , MeanIntensity , MinFeret , MinIntensity , ND.M, ND.T, Numbers , Perimeter , Radius , Red , Roughness , ShapeFactor , Source , SumBrightness , SumDensity , SumIntensity , Time , Velocity
- measured under binary objects (layers).
AcqTime , Area , BoundsAbsBottom , BoundsAbsLeft , BoundsAbsRight , BoundsAbsTop , BoundsBottom , BoundsLeft , BoundsPxBottom , BoundsPxLeft , BoundsPxRight , BoundsPxTop , BoundsRight , BoundsTop , BrightVariation , CentreX , CentreXabs , CentreXpx , CentreY , CentreYabs , CentreYpx , Channel , Circularity , Comment , Convexity , DensityVariation , Edf_Sa, Edf_Sz, EdfRoughness , EdfSurface , Elongation , EqDiameter , FieldID , FillArea , FillRatio , HueTypical , HueVariation , IntensityVariation , Length , LineLength , Mander's Coefficient, MaxFeret , MaxFeret90, MaxIntensity , Mean*ChannelName* , MeanBlue , MeanBrightness , MeanCa2+ , MeanChord , MeanCorrFRET, MeanDensity , MeanFRETEff, MeanGreen , MeanIntensity , MeanRatio , MeanRed , MeanSaturation , MeanTitration , MeasuredArea , MinDistanceTo , MinFeret , MinIntensity , NearestObjDist , Obj ID , Orientation , OuterPerimeter , Pearson Coefficient, Perimeter , PerimeterContour , Ratio, Roi ID , Roughness , RoughnessInf , ShapeFactor , Source , StartX, StartXpx, StartY, StartYpx, Sum*ChannelName* , SumBrightness , SumDensity , SumIntensity , TrackID , TreeID , Volume Center, Volume Center Abs, Volume Center Px, VolumeEqCylinder , VolumeEqSphere , Width
- measured on 3D binary objects (a thresholded Z-series data set is needed).
Centroid, Elongation , Major Axis Length, Mander's Coefficient, MeanIntensity , MinDistance , Minor Axis Length , Minor2 Axis Length , Orientation , Pearson Coefficient, Pitch , Ratio, RefDistance , Sphericity , SumIntensity , Surface , Volume , Volume Center, Volume Center Abs, Volume Center Px, Voxel Count, X, Y, Z
- measured over the whole image area.
AcqTime , BinaryArea , BinaryAreaFraction , BrightVariation , CentreX , CentreXabs , CentreXpx , CentreY , CentreYabs , CentreYpx , Channel , Comment , DensityVariation , Edf_Sa, Edf_Sz, EdfRoughness , EdfSurface , FieldID , HueTypical , HueVariation , IntensityVariation , MaxIntensity , Mean*ChannelName* , MeanBlue , MeanBrightness , MeanCa2+ , MeanChord , MeanCorrFRET, MeanDensity , MeanFRETEff, MeanGreen , MeanIntensity , MeanRatio , MeanRed , MeanSaturation , MeanTitration , MeasuredArea , MinIntensity , ND.M, ND.T, NumberObjects , NumberObjectsRestricted , Perimeter , Source , StgPosX, StgPosY, Sum*ChannelName* , SumDensity , SumIntensity , SurfVolumeRatio
- measured within ROIs.
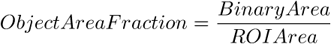
AcqTime , BrightVariation , CentreX , CentreXabs , CentreXpx , CentreY , CentreYabs , CentreYpx , Channel , Comment , DensityVariation , Edf_Sa, Edf_Sz, EdfRoughness , EdfSurface , FieldID , HueTypical , HueVariation , IntensityVariation , MaxIntensity , Mean*ChannelName* , MeanBlue , MeanBrightness , MeanCa2+ , MeanChord , MeanCorrFRET, MeanDensity , MeanFRETEff, MeanGreen , MeanIntensity , MeanRatio , MeanRed , MeanSaturation , MeanTitration , MeasuredArea , MinIntensity , ND.M, ND.T, NumberObjects , ObjectAreaFraction , Perimeter , Roi ID , ROIArea , Source , StgPosX, StgPosY, Sum*ChannelName* , SumBrightness , SumDensity , SumIntensity , SurfVolumeRatio
- can be measured only after EDF focused Image was created.
Edf Ra , Edf Rz , Edf_Sa, Edf_Sz, EdfRoughness , EdfSurface
- measured on tracked binary objects or ROIs. See also Tracking.
Accel. N , Accel. T , Acceleration , Area , Bin ID, Circularity , Diff Coeff , Diff Coeff R2 , Duration , Elevation , Elongation , EqDiameter , FileName , Generation , Heading , ID, Length , Line Speed , LineLength , MaxFeret , MaxFeret90, Mean Sq. Displacement , MeanIntensity , MinFeret , ND.M, ND.T, No.Segments , Path Length , Path Speed , Perimeter , Position X, Position Y, Position Z, Ref Line Length , Ref Object Line Length , Seg. Length , Speed , Straightness , SumIntensity , Surface , Time , TrackID , TreeID , Type , Volume , Width
- measured on general analysis 3 binaries. See also General Analysis 3 .
Centroid Abs, Centroid Px, Incircle Diameter, Min Rect Area, Object Area, Object Pixel Count, Rectangularity
Major Axis
Minor Axis
Minor2 Axis
Open a timelapse ND2 file and run
 View > Image > ND View > Slices View
  .
.Right-click one of the side views and select Create New Document from this View. A new image will be created.
Perform length measurement on the new image.
Axis length of the object based on its PCA model. λ = eigenvalue. When PCA is applied to binary voxels, it gives us three orthonormal axes 1, 2, 3 ordered by the length of the object along each axis.
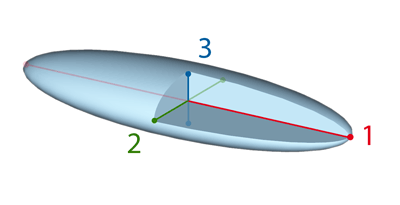
Figure 431. 3D Object Axes
See also Pitch , Orientation .
Acquisition time of the current image in seconds. If the image is a part of an image sequence, the time is measured from the beginning of the sequence. Otherwise it is the time elapsed since the software was started.
Area is a basic quantity for measuring object size.
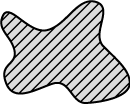
Figure 432. Area
Arithmetic mean of pixel intensities of the blue component within the measured area. See Measurement Tools. It equals 0 on other than RGB images.
These are distances (X/Y coordinates) of the left, right, top, and bottom edges of the object bounding rectangle.
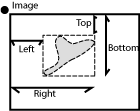
Figure 434. Bounds
These are absolute distances (X/Y coordinates) of the left, right, top, and bottom edges of the object bounding rectangle within a motorized stage range. This feature can be measured only if a motorized stage is connected.
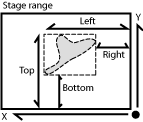
Figure 435. BoundsAbs
These are distances (X/Y coordinates) of the left, right, top, and bottom edges of the object bounding rectangle measured in pixels.
Absolute coordinates of the center of gravity in the scope of the stage XY range. These features can be measured only when a motorized stage is connected. See also BoundsAbsLeft .
Circularity of a circle equals 1. All other shapes are characterized by circularity smaller than 1. It is a derived shape measure, calculated from Area and Perimeter . It is useful for examining shape characteristics.
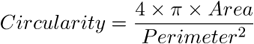
Figure 436.
Indicates convexity of the object edges.
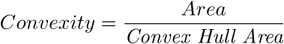
Figure 437.
“Convex Hull Area” is the area of objects after running the Binary > Convex Hull command.
See also Area .
The diffusion coefficient characterizes how a substance diffuses in time. It is a feature of a track. Having a track over k frames, we get k value pairs ((MSD1, T1), ..., (MSDk, Tk)), from which k equations are created:

Figure 438.
Number of dimensions. 2 for 2D tracking, 3 for 3D tracking.
Diffusion coefficient calculated only from the first 1/3 MSDs.
Time.
Then, the method of least squares is used to calculate a single diffusion coefficient (D) from the set of equations.
Indicates how well the calculated diffusion coefficient (Diff Coeff ) reflects the data. Diff Coef R2 = 1 means that the Diff Coef matches the data. If Diff Coef R2 = 0, Diff Coef does not match the data at all.
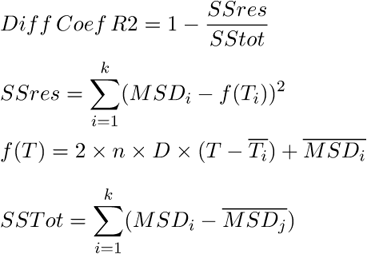
Figure 439.
Arithmetical mean height of the EDF profile specified by the  Length 3D tool. It is an arithmetical mean of absolute values of differences between 10 Z values along the profile and their mean. Its value for a flat profile is 0.
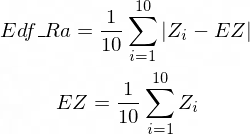
Figure 440.
EDFSurface Z coordinate measured at 10 equidistant points on the profile line.
Mean height of the 10 points on the Z-profile.
Maximum height of the EDF profile specified by the Length 3D tool. Difference between the maximal and the minimal height within the measured profile line.
Arithmetical mean height. Based on the 3D EDF surface model, it indicates how much the surface is rough. It is a sum of absolute values of differences between Z value of each pixel and mean of all Z values divided by Area . Its value for a flat surface is 0. It is the most widely used one-dimensional roughness parameter.
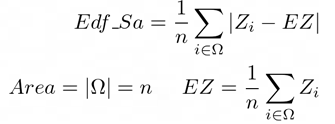
Figure 441.
EDFSurface Z coordinate of a particular pixel.
The mean height of the Z-map (mean of all Z coordinates of the EDFSurface).
Number of pixels in the measured area (image/object/ROI).
Maximum height of the EDF surface. Difference between the maximal and the minimal height within the measured area.
Based on the 3D surface model, it is an approximation of the surface area. For a flat surface, EdfSurface = Area .
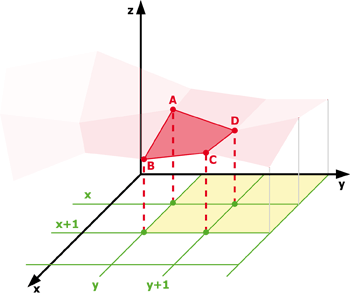
Figure 442. EdfSurface highlighted red, Area of four Edf surfaces highlighted yellow
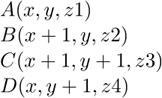
Figure 443.

Figure 444.
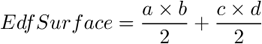
Figure 445.
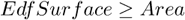
Figure 446.
Based on the 3D EDF surface model, it indicates how much the surface is rough. Its value for a flat surface is 1.
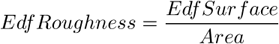
Figure 447.
See also EdfSurface and Area .
A size feature derived from the area. It determines the diameter of a circle with the same area as the measured object:
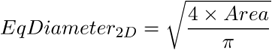
Figure 450.
Figure 451. EqDiameter
If an object contains holes, FillArea remains the same while Area is reduced by the area of the holes. If an object does not contain holes, then FillArea = Area .
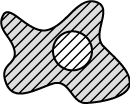
Figure 453. FillArea
The ratio of Area and FillArea :
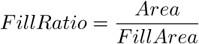
Figure 454.
If an object does not contain holes, FillRatio = 1. If an object contains holes, FillRatio is less than 1. This feature helps distinguish objects with and without holes.
IntensityVariation is derived from the intensity histogram. It is an usual standard deviation of intensity values. This feature describes the inner structure of an object or a field.
Arithmetic mean of pixel intensities of the Green component within the measured area. See Measurement Tools. It equals 0 on non-RGB images.
HueTypical (H) is the hue value with maximum frequency in the hue-values histogram. This feature describes the most frequent hue (color) in an object or field.
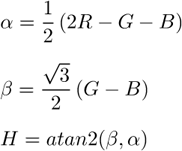
Figure 455.
HueVariation is the usual standard deviation of hue values. This feature describes hue (color) distribution of inner structure of an object or a field.
Figure 456.
Length is a derived feature appropriate for elongated or thin structures. Since it is based on the rod model, it is useful for calculating length of medial axis of thin rods.
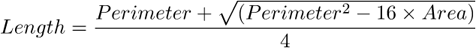
Figure 457.
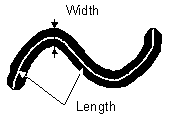
Figure 458. Length
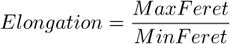
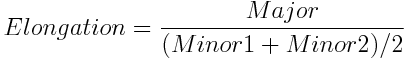
It is the length of an object with elongated shape.
For tracking it is the length of a straight line from the track origin to the current (measured) point.
See: Line Length and Speed.
It is the maximal value of the set of Feret's diameters. Generally (for convex objects), Feret's diameter at angle α equals the projected length of the object at angle α , α (0,180); NIS-Elements calculates Feret's diameters for α =0, 10, 20, 30, ..., 180.
The MaxFeret90 is a length projected across the MaxFeret diameter.
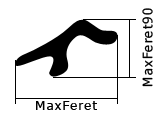
Figure 459. MaxFeret
It is derived from the intensity histogram as the maximal of all pixel intensity values (I).
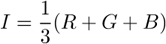
Figure 460. Intensity
Arithmetic mean of brightness values of pixels.
NIS-Elements uses brightness calibration curve for evaluation of this parameter. See Density and Brightness Calibration.
Arithmetic mean of density (O.D.) values of pixels.
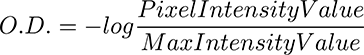
Figure 461.
NIS-Elements uses density calibration curve for evaluation of this parameter. See Density and Brightness Calibration.
Arithmetic mean of pixel intensities of one image component. See also MeanIntensity .
The mean value of secants in the 0, 45, 90 and 135 degrees directions. It is a derived feature and is calculated from the Area and mean projection according to the following formula.
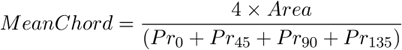
Figure 464.
Arithmetic mean of saturation values of pixels (S).
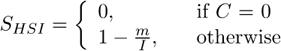
Figure 465. Saturation
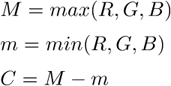
Figure 466.
Arithmetic mean of intensities of the Ratio, Ca2+, FRET / Corr FRET / FRET Eff / Ph channels. This feature is activated upon creation of the channel view.
The area of the measurement frame or a ROI within the measurement frame (if the ROI is on).
The minimal border-to-border distance to the closest binary object. If an object is inside another object, the result is 0.
The minimal value of the set of Feret's diameters. Generally (for convex objects), Feret's diameter at angle α equals the projected length of object at angle α , α (0,180); NIS-Elements calculates Feret's diameter for α =0,10,20, 30, ..., 180.
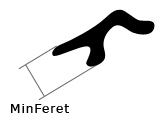
Figure 467. MinFeret
(requires: Advanced 2D Tracking)
Its value is derived from the intensity histogram. It is the minimum of intensity values of pixels.
Figure 468. Calculation of Intensity (I)
The number of objects inside the measured area. Exclusion rules for counting objects are taken into account (see Measurement Options).
Number of objects left after applying restrictions.
See also View > Analysis Controls > Restrictions  .
.
The angle at which MaxFeret is measured. Feret's diameters are calculated with 5 degrees angle increment.
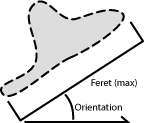
Figure 469. Orientation
Angle (O) between the X axis and the projection of the Major (M) axis in the XY plane. Orientation [0, 180).
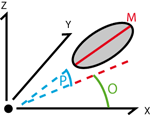
Figure 470. Orientation (O) and Pitch (P)
Length of the outer perimeter (unlike in Perimeter , holes inside the object do not count).
The total boundary length. It includes both the outer and inner boundaries (if there are holes inside an object). The perimeter is calculated from four projections in the directions 0, 45, 90 and 135 degrees using Crofton's formula
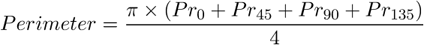
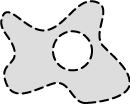
Figure 471. Perimeter
(requires: Advanced 2D Tracking)
Total boundary length computed from object contours. Compared to Perimeter , it is more accurate (especially on elongated objects) but the calculation is slower.
Angle between the Major axis and its projection in the XY plane. Pitch [0, 90].
Figure 472. Orientation (O) and Pitch (P)
Arithmetic mean of pixel intensities of the Red component within the measured area. See Measurement Tools. It equals 0 on non-RGB images.
This feature indicates how much the object is rough. “1” means the object roughness is minimal (it is circular). The range is <0;1>.
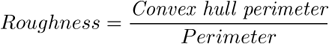
Figure 473.
This feature indicates how much the object is rough. “1” means the object roughness is minimal (it is circular). The range is <1;inf>.
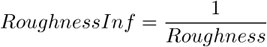
Figure 474.
Distance between centroids of the measured and the reference 3D object. Any 3D object can be set as reference from a context menu in the Measure > 3D Object Measurement  window.
This feature indicates whether the object is rough or not.
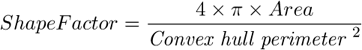
Figure 475.
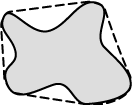
Figure 476. ShapeFactor
Similarity to a sphere, computed as the ratio of the object surface and the surface of a sphere with matching volume. A sphere has the maximum Sphericity = 1.
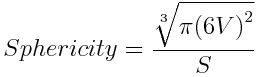
Figure 477.
Volume
Surface
When you scan the image from the origin in left-to-right direction, the first pixel of the object you hit is the one with StartX and StartY coordinates.
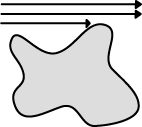
Figure 478. StartX, StartY
Coordinates of the absolute position of the measured field. It is available only for systems equipped with a motorized XY stage.
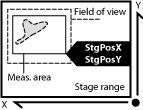
Figure 479. StgPos
Indicates overall straightness of the object trajectory calculated by the following formula. The value range is 0.0 - 1.0.
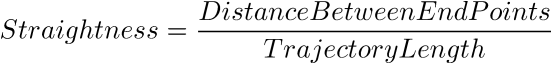
Figure 480. Straightness
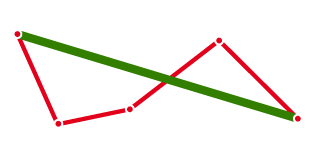
Figure 481.
A sum of individual optical densities (O.D.) of pixels in the measured area. This feature describes, for instance, the amount of a substance in biological sections. Optical density is evaluated according to the following formula:
Figure 482.
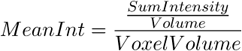
Sum of intensity of all pixels/voxels of the object.
SurfVolumeRatio is a feature with a strong stereological interpretation: if you measure on fields that are sampled systematically and independently of the content of the sections, then the feature is an unbiased estimator of the surface area of objects (inner structure) per volume of the whole sample.
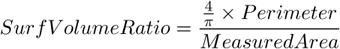
Figure 483.
See also Perimeter and MeasuredArea .
Time is assigned to a field (object) after the tracking measurement has been performed. See the SetReferenceTime function help.
Time interval measured on a 1DT document. See also Velocity .
(requires: Object tracking 2D)
If branching of tracks is allowed, each branch has its own TrackID.
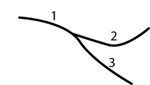
Figure 484. TrackID
(requires: Object tracking 2D)
If branching of tracks is allowed, all branches of one track form a tree and therefore share the same TreeID.
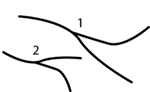
Figure 485. TreeID
This parameter is based on the rod model. Length is interpreted as height and Width is interpreted as the base diameter of a cylinder.
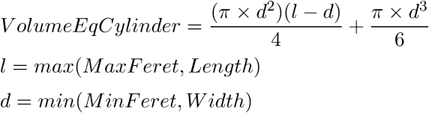
Figure 486.
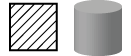
Figure 487. VolumeEqCylinder
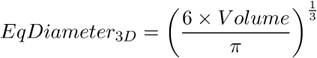
Volume of a sphere whose diameter is equal to EqDiameter of the measured 2D object.
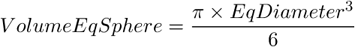
Figure 488. VolumeEqSphere

Width is a derived feature appropriate for elongated or thin structures. It is based on the rod model and is calculated according to the following formula:
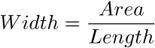
Figure 490.
Figure 491. Width
Distinguishes type of tracked objects. Name of the binary layer or ROI number is displayed.
When track splitting is performed, this feature displays the generation of each track. The parent track has Generation = 1, tracks after first splitting have Generation = 2, etc.
Mean Square Displacement of the track calculated as a sum of squared distances from the beginning of the track.
Segment length divided by the amount of time elapsed between the two positions.
See: Track Segments.
Length of a straight line from the Reference Point defined by the user to the current point.
See: Reference Line Length.
Length of a straight line from the Reference Object (e.g. a Track) defined by the user to the current point.
LineLength divided by the time elapsed. It represents the speed of progression of a given object.
See: Line Length and Speed.
Total force that is acting on an object calculated using speed difference between the next and the current segment.
See: Acceleration.
Tangential acceleration having the same direction as the velocity vector.
See: Acceleration.
Normal acceleration - the part of acceleration vector that is perpendicular to the velocity vector incoming to the current object position.
See: Acceleration.
Sum of the segment distances from the first frame to the current frame.
See: Track Segments.
Length of the path divided by the amount of time elapsed from the beginning to the current position.
See: Track Segments.
Elevation is the angle between the direction of the velocity vector and the XY plane. Positive elevation is towards positive Z coordinates. The values range from -90 to 90.
| (requires: Advanced 2D Tracking) |
| and |
| (requires: 3D Measurement) |
See: Heading and Elevation.
Angle between the direction of the velocity vector and the X axis. Zero degrees is in the direction of X axis (to the right) and increases counterclockwise until 360.
See: Heading and Elevation.
X,Y,Z coordinates of the object's centroid.
(requires: Advanced 2D Tracking) and (requires: 3D Measurement)
Speed measured between two points defined manually. This feature can be measured on a 1DT image using length measurement tools. 1DT image can be created from a timelapse ND file.
Lengths of the major (A) and minor (B) axes of an ellipse and their ratio. See Measurement Tools.
3D length measured manually. Length xyz is the actual length measured on Slices View or Volume View. Length xy is length of a projection of the measured line to the XY plane. See Measurement Tools.
Calculates absolute coordinates of the centroid of each object in the scope of the stage XY range.
Calculates the diameter of an inscribed circle of each object in the connected binary result.
Calculates Mander's overlap (MOC), Manders overlap coefficients (k1, k2) and Mander's colocalization coefficients (M1, M2).
See description of the View > Analysis Controls > Colocalization  panel.
MOC - ranges from 0 to 1.
k1, k2 - range from 0 to oo. MOC^2 = k1 * k2
range from 0 to 1, where 1 implies perfect colocalization. They are not sensitive to intensity of overlapping pixels, but are very sensitive to background. A proper background subtraction step is necessary before measuring these coefficients.
is a fraction of R in areas containing G
is a fraction of G in areas containing R
Calculates the minimal rectangular area for each object in the connected binary result.
Calculates the Pearson correlation coefficient for pixels from two inputs (B, C) under input binary mask. The coefficient ranges from -1 to 1. A value of 1 implies positive linear relationship for which C increases as B increases. A value of -1 implies negative linear relationship for which C decreases as B increases. A value of 0 implies that there is no linear correlation between B and C.
See description of the View > Analysis Controls > Colocalization panel.
Calculates the mean of ratios between corresponding pixels of the two input channels under the input binary mask.
Calculates the X, Y and Z distance from the top left corner to the center of gravity of each object.
Calculates absolute coordinates of the center of gravity of each object in the scope of the stage XYZ range.