
LUTs is a useful tool for image color and brightness modifications. You can use LUTs to enhance images for observation purposes so the color modifications will be non-destructive to the image data. LUTs settings are saved along with the image file. If required, the LUTs settings can be applied to the image data by pressing the  button. Use the
  Show LUTs window button in the image toolbar to display the LUTs window.
The following actions are available within the LUTs window:
Adjusting the Gamma parameter. The gamma curve is drawn in gray over each graph. You can drag the middle point and move it up or down, or enter an exact value to the G: field at the top of the graph area.
Adjusting the input intensity range. The input intensity range can be restricted by moving the black and white triangular sliders to the center. All pixels with values outside of the modified input range will be set to maximum/minimum values and the remaining pixels will be approximated in order to fill the output (full) range.
Note
This is the way how images can be equalized. For example, if the image is very dark and most of the histogram is located to the left while the right part of it is flat, you may move the white slider(s) to the position where the histogram line starts to rise. This will incredibly brighten the image and reveal details which were previously hidden in a dark.
You can adjust the histograms height non-proportionally by moving the slider on the left side of the window up and down.
Tips
Different controls will be available when applying LUTs to monochromatic, RGB, multi-channel or spectral image. When LUTs are active, the LUTs button in the top-left corner of the image window is highlighted red.
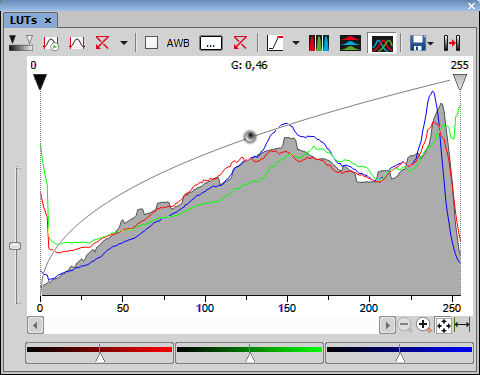
Figure 361.
There are 3 separate windows for each of the RGB channels. All channels are controlled at the same time by default. To control each channel separately, press and hold the Shift key while you drag the sliders or adjust Gamma.
LUTs Tools
 Enable/Disable LUTs
 Keep Auto Scale
 Press this button to run the auto scale procedure permanently (on the live image). When you turn this button OFF, the settings remain as if the Auto Scale button was pressed only once.
 Auto Scale
 This button adjusts the white slider position of all channels automatically with the purpose to enhance the image reasonably. If you have selected the Use Black Level option from the Settings pull-down menu, the black slider will be affected too.

Display the pull down menu next to the  Reset All Components button and select one of the following commands:
You can change opacity of a Brightfield channel. Define the opacity in the Brightfield Opacity dialog window that appears after you run this command.
Check this item to ensure that the black slider will be affected by the auto scale functions.
opens the Auto Scale Settings window. See Auto Scale Settings.
Check this box to switch the Auto White Balance functionality permanently ON (on the live image).
This button Opens the AWB Color window and enables you to select a color shade which the system shall eliminate (make white). See AWB.
Reset AWB If Keep Auto White Balance or Auto White Balance function is applied, this button turns it off.
 Pixel saturation indication
 Switch this button ON and the system highlights all pixels with values reaching maximal values. Select colors to highlight the pixels with in the pull-down menu. See also Channel Coloring.


This button arranges histograms of single channels overlapped. Use sliders at the bottom of the graph window to amplify or reduce the green/red/blue component display in the view.
 Save/Load LUTs
 This pull-down menu enables user to handle LUTs settings in various ways. They can be saved to a *.lut file and loaded later. Or, LUTs settings saved along with an image can be loaded directly from this image by the Reuse LUTs from File command. Or you can copy/paste the settings within the documents opened in NIS-Elements.
Press this button to apply the LUTs settings to the image data - the original image will be overwritten. Until you press this button, no changes are made to the image data.
 Reset Zoom
 Auto Range
 Zooms the histogram so that the “high” and “low” limits are distinguishable. For example, if a small intensity range is defined on a 16bit image the low and high lines are displayed as one-pixel line. Pressing this button will stretch the histogram in order to display the lines separately.
Press the arrow next to the Reset LUTs button and a pull-down menu appears. Invoke the Settings command.
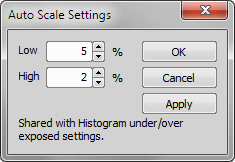
Figure 362.
Quantiles indicate what percentage of pixels will be below/above the threshold for black level and white level when Auto Scale is applied.
Quantiles for brightfield channels (or all channels that are not fluorescence, including FRET and other special channels).
The Low and High fields determine how many of all pixels of the picture are left outside the sliders when Auto Scale is applied (0-10%).
The first check box specifies whether black level (checked) or only white level (unchecked) will be calculated during auto scale.
Quantiles for fluorescence channels.
The Low and High fields determine how many of all pixels of the picture are left outside the sliders when Auto Scale is applied (0-10%).
The first check box specifies whether black level (checked) or only white level (unchecked) will be calculated during auto scale.
(requires: Local Option)
When Intelligent Auto Scale is checked, the values are calculated without extremes – without 0 and without 255 (for 8-bit), or 4095 (for 12-bit), etc. This is especially important for images from the slide scanning system and some JOBs where only a specific area of interest is scanned and a large part of the image remains black.
White color in some images may suffer from having a color tint. The AWB (Auto White Balance) mode adjusts the image to get pure white instead of this tint. Similarly to LUTs auto scale, the AWB function can be used once, or permanently on the live image. If you know the tint your “white” color has, you can select this color by the color picker that appears after pressing the ... button:
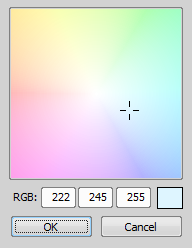
Figure 363.
Choose the color by mouse. You can also enter the RGB values to the fields below. A preview of the chosen color appears in the rightmost rectangle.
All features mentioned above are also valid for monochromatic images, except that the AWB function is not available. There are some other features added when in “mono” mode.
Mapping monochromatic images to pseudo-color gradients is often used to enhance details in the image which would otherwise not be obvious. This button indicates the currently selected gradient. When pressed, a pull-down menu appears where you can select the color scheme you would like to use. Try a few of the schemes to see which one suits best.
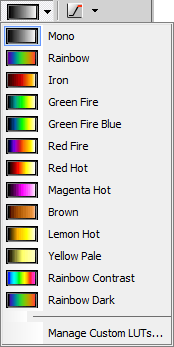
Figure 364.
The Manage Custom LUTs command in the pull down menu defines a custom LUTs gradient. Use the tools available in the dialog window to define your custom gradients. They then appear in the pull down menu ready to be applied. Please see  View > Image > LUTs > Create Custom LUTs for details about the custom LUTs definition.
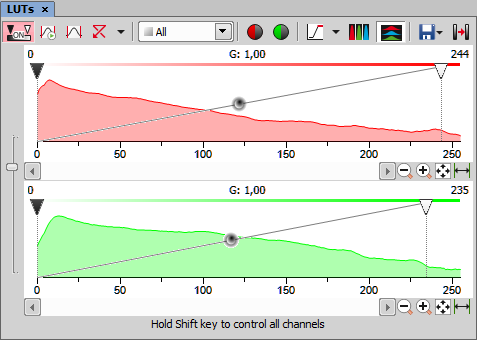
Figure 365. LUTs window on two-channel image
Most of features mentioned above are also valid for multi-channel images. There are some other features added when in “multi-channel” mode. Each channel is controlled separately by default. To control all channels at the same time, press and hold the Shift key while you drag the sliders or adjust Gamma.
When the image contains up to three channels, all channels can be visible at the same time and you can handle them similarly to the RGB mode. When there are more than three channels, only one channel is displayed at a time. A pull-down menu in the toolbar enables you to select the channel to be displayed.
Next to the channel selection pull-down menu, there is this  Auto Scale button. By pressing it, the system will automatically adjust only the current channel settings.
When observing a spectral image, the graph inside the LUTs window does not show the image histogram(s), but reveals another information about the image. Intensity values are on the Y axis and spectra is on the X. There are two curves in the graph. The top (white) curve displays the maximal intensity and the color curve displays the mean intensity of each channel.
Note
Spectral image consists of many channels, each representing a single wavelength.
The LUTs behavior depends on the selected displaying mode. There are four displaying modes. You can select the mode either by a pull-down menu in the LUTs toolbar, or within the image top toolbar.
In the bottom part of the LUTs window, Brightness and Black Level settings can be adjusted either for all channels together or for each group separately - depending on the displaying mode.
Note
The Brightness and Black Level sliders offer a range of values to be set by moving them, but any higher value can be entered in the field next of the sliders.
TD channel
A spectral image can contain additional TD (transmitted detector) channel. Its basically a standard monochromatic image. LUTs settings of this channel appear on the right edge of the LUTs window.
True Color Displaying Mode
You can switch to this displaying mode by clicking the  button located in the image toolbar.
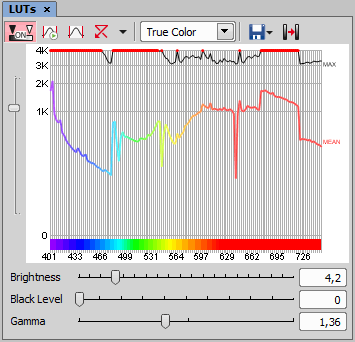
Figure 366.
Custom Color Displaying Mode
You can switch to this displaying mode by clicking the  button located in the image toolbar. You can assign custom colors to sections of the spectrum. Sections (colors) can be added/removed by clicking the + and - buttons placed below the spectral graph. To change the section color, click the button located in the color stripe. A window appears where you can select the color from a palette or define it by Hue or Wavelength settings.
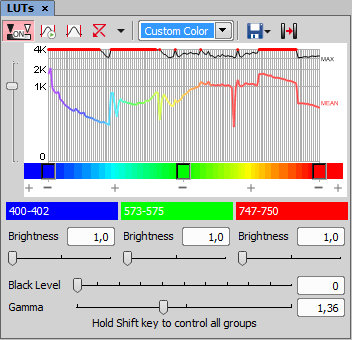
Figure 367.
Grouped Displaying Mode
You can switch to this displaying mode by clicking the  button located in the image toolbar. This view enables you to reduce the number of channels multiple-times. You can adjust the number of groups by the + and - buttons and also change each channel width by moving the white horizontal dividers. Brightness and Black Level for each group can be adjusted.
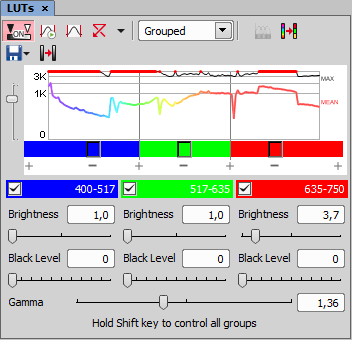
Figure 368.
Gray Scale Displaying Mode
You can switch to this displaying mode by clicking the  button located in the image toolbar. The image is displayed in gray scale, but various color gradients can be applied to it.
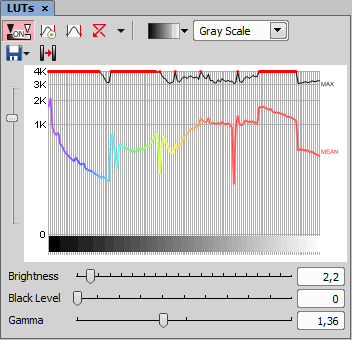
Figure 369.