
Specifying correct threshold limits is a crucial procedure of the automated image analysis. The point is to determine which pixels will and which will not be included in the binary layer and thereby distinguish objects to be analyzed from background. Thresholding can be performed in the following modes:
Open or capture the image to be thresholded.
Run the
 View > Analysis Controls > Thresholding
  command to display the Thresholding panel:
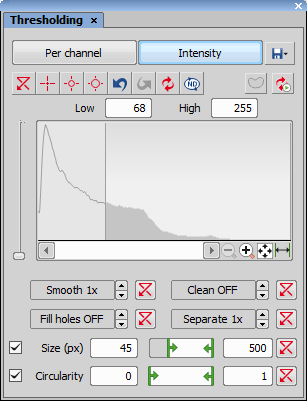
Figure 387. Thresholding panel
In the top toolbar, select the color mode which will be used for thresholding. According to the type of image opened, the following modes could be available: RGB, HSI, Intensity and MCH. See Color Modes.
Select one of the pixel-picking tools (e.g.
 ) and start clicking on objects in the image you want to detect. Color values of each of the clicked pixel(s) are used to adjust the low and the high threshold values so that the clicked pixel would stay inside the thresholded interval.
Apart from this “clicking” method, the thresholds can be adjusted directly within the histogram by dragging the vertical lines which highlight the thresholded interval.
All pixels having their numeric values inside the thresholded interval become a part of the resulting binary layer.
Very often, also other binary objects appear in the image which you did not intend to detect, for example dust particles with intensity similar to the specimen, etc. To eliminate these mis-detected object, use one or more tools available at the bottom of the panel. You can either apply some morphology functions to the binary layer or apply size or circularity restrictions to detected objects. See Tips and Tricks.
The RGB thresholding mode is available only if an RGB image is opened. There are two ways how to define the threshold limits, by choosing reference points within the image, or by defining the limit values for each color channel.
The HSI thresholding mode is available only if an RGB image is opened. The thresholding procedure works the same way as in the RGB mode except that the pixel values are displayed in the HSI (Hue, Saturation, Intensity) color space and that the Saturation and Intensity channels can be switched OFF. Therefore you can threshold over the H, HS, or HI channels only. Switch the channel off by deselecting the check box in the top-left corner of the channel histogram.
In this mode, the channels are handled separately, a binary layer is created for each channel and also, the binary processing functions (Smooth, ...) can be adjusted differently for each channel. Switch between the channels by selecting their names in the bottom pull-down menu.
This mode is dedicated to perform threshold on multichannel images, but can be applied to RGB images as well. It is not available when working with a monochromatic (single channel) image.
The thresholding procedure works the same way as in the RGB mode except that it is performed on the intensity pixel values.
 ResetPick threshold from image - single pixel
 Select it and click inside the image to define the threshold. The threshold ranges will be adjusted so the selected pixel will fit inside.
 Pick threshold from image - 3 point circle
 Pick threshold from image - 6 point circle
 Undo
Undo Redo
Redo Save/Load Threshold Settings
 This button invokes a pull-down menu which enables the user to load/save the current threshold settings from/to an external file (*.threshold).

 Zoom
Zoom Auto Zoom
 Auto Range
 Zooms the histogram so that the “high” and “low” threshold lines are distinguishable. For example, if a small intensity range is defined on a 16bit image the low and high lines are displayed as one-pixel line. Pressing this button will stretch the histogram in order to display the lines separately.
Threshold the image using the Intensity measurement option in the Thresholding control panel.
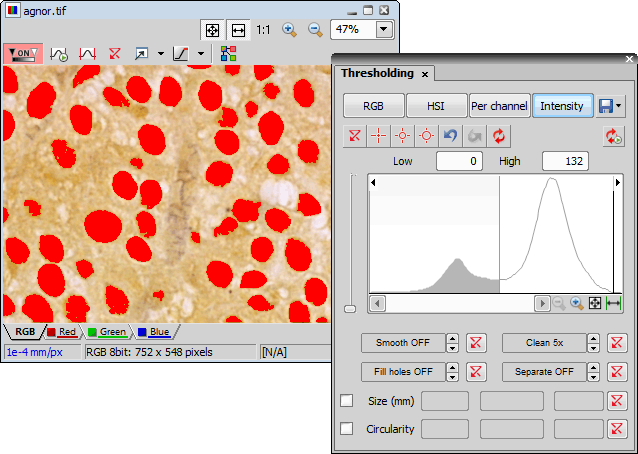
Figure 388.
Select features to be measured in the Automated Measurement Results control panel. Press the Options button and choose the Select Object Features command. An Object Measurement Setup window appears. Add or remove features you want to measure.
Press the
 Update measurement button in the Automated Measurement Results control panel to measure image features. Overview the results. Press the Store Data button to save the data for future reference.
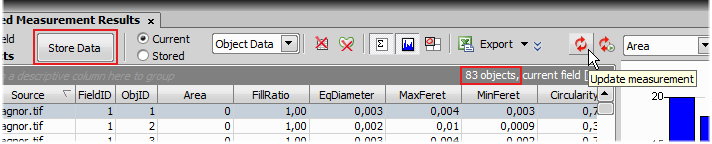
Figure 389.
Right click the
 Turn ROI On/Off button in the right document toolbar. Choose the ROI > Move Binary to ROI command. Each binary object turns into separate ROI.
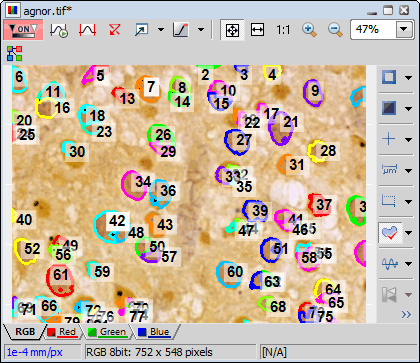
Figure 390.
Threshold the cell nucleoli in the nuclei the same way as was already described above using the Thresholding control panel.
Measure the thresholded nucleoli using the
Update measurement button in the Automated measurement Results control panel. Press the Store Data button to save the data.Group results per ROI: drag the title of the column called RoiID into the grey area above the columns. You can drag and drop any combination of features as well. Results always group according to such selected features.
Turn on the graph using the
 Show Histogram button.
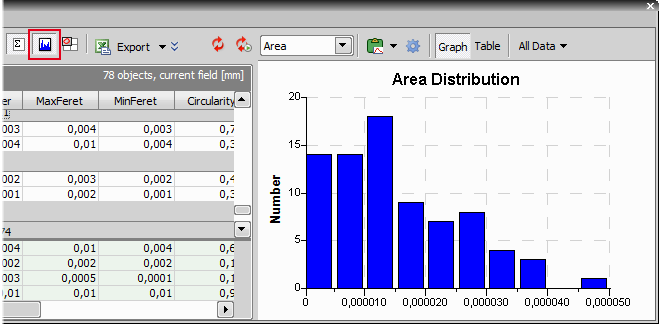
Figure 391.
The histogram displays the selected feature of interest. If you want to display different feature - press the right mouse button over the data table on the left and open the Feature of Interest submenu. Select another feature. The histogram recalculates automatically.
To get the information about area percentage, select the Field measurement option in the top toolbar of the Automated measurement Results control panel.
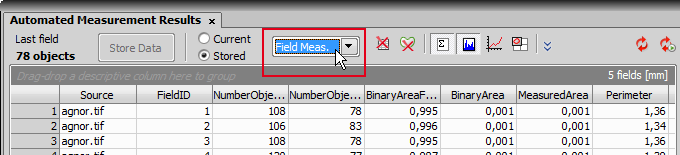
Figure 392. Example
Field 1 displays results of measurement when measured without ROI. That means % of nucleoli in the entire image.
Field 2 displays results of measurement when measure with ROI on. That means % of nucleoli within the nuclei.
You can export the result to various locations using the Export command.
Threshold Adjustments
Thresholding parameters can be adjusted very precisely in the following way:
Threshold limits of each channel can be adjusted by rewriting the values in the top-left/top-right corner of each channel histogram.
Threshold range of each channel (the colored stripe) can be shifted by mouse. Place the cursor in the middle of the range (a circle appears) and drag it left or right.
Threshold limits of each channel can be adjusted by mouse. Place the cursor on the edge of the thresholding range and drag it left or right.
The two last behaviors can be further modified by pressing additional keys:
Move the threshold using the right mouse button - the binary layer in the image is not updated continuously, but is updated only once after the mouse button is released. Such operation saves some computing and therefore is quicker.
Hold Shift while moving the threshold limits - the threshold adjustment is performed on all channels together (RGB images only).
Hold Ctrl while moving the threshold limits - both the low and the high threshold limits move in opposite directions.
Binary Operations
Four basic operations can be performed on the binary layer before it is displayed on screen. To turn the operation on, click on the up arrow button in order to define the number of its iterations:
Restrictions
Thresholding Large Images
If thresholding images larger than 5000 x 5000 pixels, a new check box called Preview on selected area only is displayed. This feature displays the threshold preview just on a limited area to speed up the thresholding adjustment.
Changing Appearance of the Binary Layer
To change the color or transparency of the layer, right-click the  Overlay button in the right image toolbar. A contextual menu appears, where you can select one of the predefined transparency levels, or run the Colorize Binary Objects command. This command displays the binary objects in several different colors. The algorithm ensures that two neighboring objects are never colored by similar colors.
This function opens the Spot Detection dialog window. It is used mainly for detecting circular objects with similar sizes. Bright spot and dark spot detection methods are split into individual dialog windows.
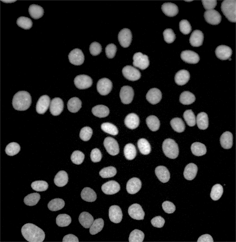
Figure 393. A typical, suitable sample for Spot Detection.
How to detect Circular Areas
Open your image for the detection.
Select the proper detection method. For bright spots on a dark background run Bright Spots. For dark spots on a bright background run Dark Spots.
Select the Channel on which the detection will be performed.
Choose the Clustered or Different Sizes detection Method based on your image.
Adjust the Typical Diameter of the objects you want to detect so that they fit tightly inside the circles.
Remove unwanted objects by adjusting the Contrast value. When it is set to zero, all spots with the set diameter are detected. Once you raise the value, spots with the lowest contrast will start to disappear.
Optionally adjust the Remove Dark Objects slider to remove undesirable dark spots.
If you are satisfied with the object detection, choose where to apply the current settings (Current Frame, All Frames or a Selection) and click . Now you can save the new binary layer together with your file.
Note
Circular areas detected close to each other are automatically separated.
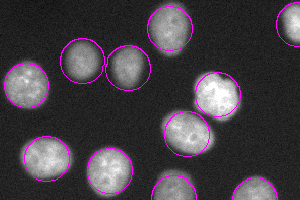
Figure 394. Circular Area output
How to detect Spots
Do steps 1-8 from the How to detect Circular Areas procedure.
Switch the Output from Circular Area to Spot and adjust the pixel size of the spots.
Choose where to apply the current settings (Current Frame, All Frames or a Selection) and click .
How to detect Growing
Do steps 1-8 from the How to detect Circular Areas procedure.
Adjust the slider position to augment/diminish the regions. Optionally use the
Pick intensity feature to grab the pixel intensity threshold directly from your image.Choose where to apply the current settings (Current Frame, All Frames or a Selection) and click .
Spot Detection Options
Select a channel on which you want to detect objects. If multichannel file is opened, spectral group selection is available.
For Bright Spots detection choose  Bright, Clustered detection method, if you want to detect clustered bright objects on a dark background, or
  Bright, Different Sizes for detecting differently sized bright objects on a dark background.
For Dark Spots detection choose  Dark, Clustered detection method if your clustered objects are dark and their background is light or
  Dark, Different Sizes method if your objects have different sizes and your background is light.
Binary output defines in which form the detected objects will be saved. Circular Area saves one circle for each detected spot whereas Spot saves a center point with a defined pixel size.
The Growing check box can be used to save grown regions with borders between adjacent spots. The function itself finds local threshold values for each of the spots detected. Therefore it matches the exact shape of the object. The numeric value represents image intensity degrees. Pick intensity function can be used to get a reference pixel intensity from the picture by a single mouse click. Use the slider to adjust the Growing value.
Can be used to add yet undetected/remove already detected spots based on their symmetry.
Check this option and adjust the position of the slider to exclude dark objects. The more left you move the slider, the more objects appear.
 Save/Load Configuration