
Report Generator allows the user to create a print-ready document which can contain measured data, images, graphs, etc. Once you start it by the  File > Report > New Blank Report command, a graphical editor appears.
Figure 493.
Creating of a report in Report Generator is very similar to creating any document in a common text editor. You can insert text fields, simple shapes, images, tables or graphs. As well as in text editors, you can create templates containing objects which do not change such as headers and footers, but also dynamic objects to be filled with data (e.g.: image name, author, etc) filled upon creation of the report. This comes especially handy in connection with the Database Module module where database fields are loaded to the report(s) automatically.
A report is composed of report objects. In the left toolbar, there are tools for inserting different objects.
Select one of the tools
Click and move the mouse inside the report to determine the area reserved for the object. Release the mouse button.
Double-click the report object to open a window where its properties can be adjusted. Some properties are common to all types of objects (Common Object Properties), and some are special (Objects and their Unique Properties).
Confirm the changes by .
Tip
Vector objects (report objects, annotations, interactive measurement objects, ROIs) can be copied by “drag and drop” while holding the Shift key down.
Select the object(s).
Press Shift and drag the object somewhere.
A copy of the object is placed to where you release the mouse button.
Line and fill colors can be selected from a pull-down menu.
Select width of the object border within the range of 0,25 to 6 pts. If you require no border, set the Line Color option to “Transparent”.
The precise position can be determined by defining the XY coordinates of the top-left corner of the object.
Precise width, height or length of the objects can be set.
Angle of rotation of some objects can be set.
 Line
Line Select this tool to insert a line to the report. See Common Object Properties.
 Rectangle
 Select this tool to insert a rectangle to the report. See Common Object Properties.
 Ellipse
 Click this to draw an ellipse. See Common Object Properties.
Ellipse semi-axes may be displayed. Select color of the “Dimension line” and set its width.
Set precise length of the ellipse axes.
Click this to draw an arrow. See also Edit > Insert Arrow for description of arrow properties.
 Text Box
 Click this to insert a text box. See also Edit > Insert Text for description of text-box properties.
 Image
Image Click this to insert an image. See Common Object Properties.
A new picture from disk can be loaded to the image frame via this button.
The current image scale is displayed in the properties window. It shows the current scale / original image dimensions ratio (the image must be calibrated to use this feature). You can use this field to set size of the image - e.g.: 10:1.
A scale bar can be displayed below the image. The position and actual width of the scale bar can be defined.
Note
When you draw the rectangle determining the image area a pull-down menu appears. Either select to Insert Picture from File, or Insert Dynamic Picture when inserting for example the current image opened in NIS-Elements. See Dynamic Data.
 Table
Table To modify properties of the whole table, place the mouse cursor slightly over the top edge and double-click. You can also modify properties (borders) of a single cell. To do so, right-click inside the cell and select Properties.
Set number of rows and columns to add or remove them.
Empty space left between the border and cell content.
 Graph
Graph Click this to insert a graph. You will be asked to select a data source for the graph. You may this action and make it later - see Dynamic Data.
The range of displayed values can be limited by defining the min/max values.
Width of a single bin. For example, having Bin width set to 2, values 0.5, 1, 1.5 will be accumulated/displayed in the first column.
Type in titles to be displayed by the graph.
 Barcode
 It is possible to insert bar-codes to the report. In the dialog window, the code can be specified:
Enter the data which the barcode will contain.
Select a barcode standard.
Note
The Interleaved 2 of 5 standard can contain digits only.
If enabled, you can select whether the barcode should contain a “check digit” - an extra number computed from the given code which reduces the risk of an error when reading it.
It adds a space around the barcode to ensure it is read correctly.
Check this to rotate the barcode by 90 degrees.
 Band
Band A band is a report template object which defines an area to be filled with dynamic data. This area will automatically repeat itself upon generating the report until there are some data to be displayed.
 Page Header,
  Page Footer
 Displays a dashed line at the top/bottom of the report template page. Move the line to determine the size of the header/footer. Objects placed within this area will appear on every page of the resulting report.
Align Objects


You can align two objects to the same horizontal or vertical level.
Select more objects (e.g. by holding down CTRL and clicking with the primary mouse button).
Right-click one of the selected objects and select the Align or Distribute > Align command from the context menu.
The objects will be aligned as indicated on the command icon.
If the Relative to Page (
 ) option is turned on, the objects will be aligned to the edges or the center of the page.
Distribute Objects


Objects of similar size can be distributed uniformly in the horizontal/vertical direction.
Select three or more objects.
Right click one of the objects and select the Align or Distribute > Distribute Horizontally command from the context menu.
Distances between the objects will be adjusted to equal.
If the Relative to Page option (
) is turned ON, the outer objects will be moved to the edges of the page.
Match Object Sizes
Sizes of objects can be unified too.
Results of automatic-interactive measurement, graphs, or the current image can be inserted to reports.
List of Available Dynamic Data Sources:
Data inserted by user (available for: image, text, table) - the system will ask you to type a text or browse for an image to insert during the report creation. When creating a dynamic object of this type, a query text which will be used to prompt you for the data can be defined.
System data (available for: text, table) - enables you to insert some general data such as date, the name of the user account currently logged in, the page number, or the page count.
Macro (available for: text, table) - enables you to insert expressions, values, or results of a macro.
Measurement (available for: text, table, graph) - enables you to insert results of automatic/interactive measurement.
Database (available for: image, text, table) - this data source is displayed only when creating a database report template (see below). It enables you to insert a link to any of the database records.
The real purpose of the dynamic data turns up when creating reports using report templates.
A report template is a layout defining the appearance of future reports, which is ready to be filled with data. The data can be inserted by the user “on demand” or automatically (dynamic data).
To Create a Report Template
Run the
File > Report > New Blank Report command. An empty report appears.In the Report Generator, select
File > Change to Template.Edit the report template in the same way as a common report.
Insert the dynamic data where it is appropriate - measurement results to text boxes or tables, the current image to the image field, etc.).
Save the report template (*.rtt) via the
File > Save  command.
To Create a Report FROM Template
If the template is opened inside the Report Generator, run the
File > Create Report command. Otherwise, use the File > Report > New Report from Template > Browse command inside the main application window to open a template from hard disk.A report opens and the dynamic data is inserted automatically.
Save the report, print it, or export the page(s) to PDF using the commands from the File menu.
Some applications in NIS-Elements come with predefined report templates that can be directly used or customized for your specific measurement needs.
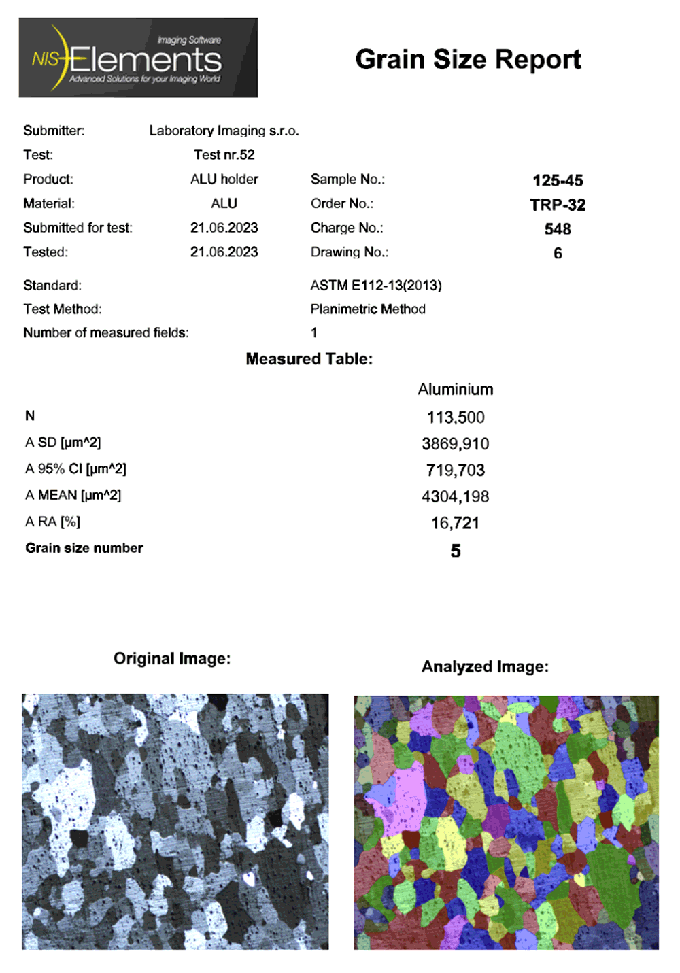
Figure 494. Report example: Grain Size Analysis
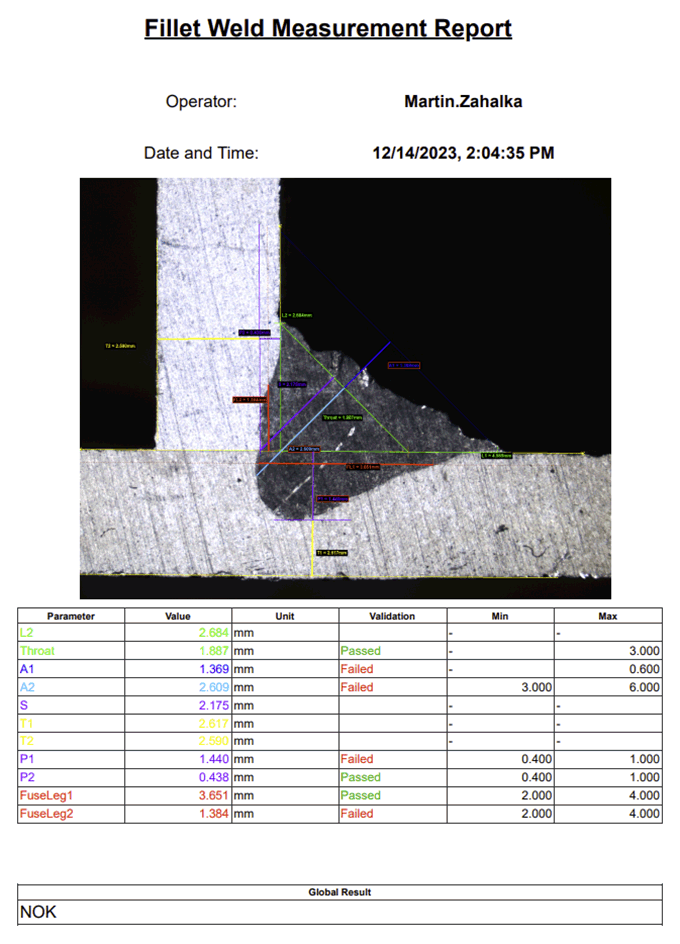
Figure 495. Report example: Measurement Sequencer