pixel with the greatest deflection in the color plane that predominates in the image,
dark pixel,
light pixel.
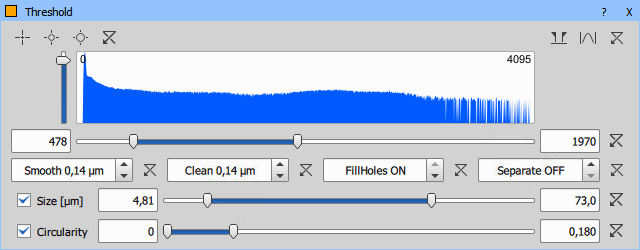
Thresholds the connected result using a simple slider and creates a binary.


 Picking tools
 Select a picking tool and click on objects in the image you wish to detect. Color values of each of the clicked pixel(s) are used to adjust the low and the high threshold values so that the clicked pixel would stay inside the thresholded interval. To reset the threshold values back to default click  .
.
The histogram can be zoomed using the top-right icons:
 Custom Range
 Zooms to the current range.
These binary processing functions can be activated and their value adjusted using the arrows or directly by typing the value into the edit box. Fill Holes processing can only be turned on/off whereas the values of other processings are applied as a radius in µm or px.
For more information about thresholding please see Thresholding.
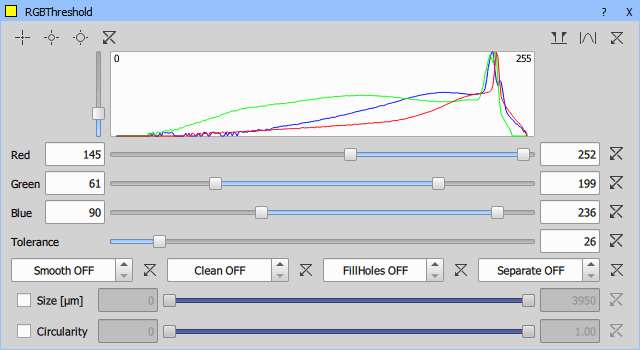
Thresholds the connected RGB result and creates a binary.


 Picking tools
 Select a picking tool and click on objects in the image you wish to detect. Color values of each of the clicked pixel(s) are used to adjust the low and the high threshold values so that the clicked pixel would stay inside the thresholded interval. To reset the threshold values back to default click  .
.
The histogram can be zoomed using the top-right icons:
 Custom Range
 Zooms to the current range.
These binary processing functions can be activated and their value adjusted using the arrows or directly by typing the value into the edit box. Fill Holes processing can only be turned on/off whereas the values of other processings are applied as a radius in µm or px.
For more information about RGB thresholding please see Thresholding.
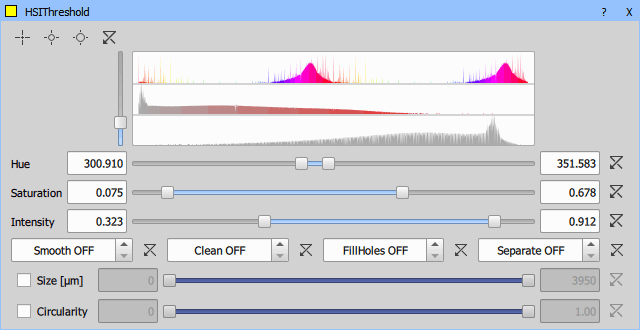
Thresholds the connected RGB result based on Hue, Saturation and Intensity and creates a binary result.


 Picking tools
 Select a picking tool and click on objects in the image you wish to detect. Color values of each of the clicked pixel(s) are used to adjust the low and the high threshold values so that the clicked pixel would stay inside the thresholded interval. To reset the threshold values back to default click  .
.
These binary processing functions can be activated and their value adjusted using the arrows or directly by typing the value into the edit box. Fill Holes processing can only be turned on/off whereas the values of other processings are applied as a radius in µm or px.
For more information about HSI thresholding please see Thresholding.
Thresholds the connected result using a simple slider and creates a binary.


 Picking tools
 Select a picking tool and click on objects in the image you wish to detect. Color values of each of the clicked pixel(s) are used to adjust the low and the high threshold values so that the clicked pixel would stay inside the thresholded interval. To reset the threshold values back to default click  .
.
The histogram can be zoomed using the top-right icons:
 Custom Range
 Zooms to the current range.
For more information about thresholding please see Thresholding.
Calculates the threshold values of Multilevel Otsu's thresholding and thresholds the connected image to multiple binary layers. Select the number of output binary layers using the Levels option.
For more information please see Otsu's method.
Note
Used algorithm is time-consuming. With increasing number of layers the accuracy is decreasing to improve its speed. However accuracy is not decreased for two or three levels.
Note
When connected to an RGB image, the algorithm calculates thresholds for image converted to a grayscale (intensity) channel.
This function opens the Spot Detection dialog window in the Bright Spots mode. It is used mainly for detecting circular objects with similar sizes. For more information please see Spot Detection.
Note
General analysis 3 spot detection uses the Different Sizes object detection method.
This function opens the Spot Detection dialog window in the Dark Spots mode. It is used mainly for detecting circular objects with similar sizes. For more information please see Spot Detection.
Note
General analysis 3 spot detection uses the Different Sizes object detection method.
Opens the Homogeneous Area Detection dialog window suitable for detecting objects on a homogeneous background and objects which are difficult to segment. Advantage of this function is that the objects do not need to be distinguished by intensity because the function works with edges. This is useful especially for DIC and phase-contrast images.
Channel on which the detection will be performed.
Inverts the detected binary.
The higher the value, the more compact object border is created.
Try which method works best for your image. In some cases, the Variance Based Method may bring better results.
Use this slider to find the optimal threshold for your objects.
Performs automatic Immunohistochemistry (IHC) cell diagnosis on the connected color image creating two binary images - one Positive (segmented from bright blue colors) and one Negative (segmented from dark brown colors). The third segmented class is the background (usually white) which is not shown as an output.
Conditions for the inclusion into these three classes vary from image to image and it is impossible to make implicit segmentation conditions. Therefore, the K-means algorithm (k = 3, unsupervised clustering) is used.
First, the image pixels are converted to an alpha-beta-intensity color space (related to the HSL model). Then the initialization is done on a:
The K-means algorithm iterates over pixels, assigns it to the nearest cluster (in a converted color model), and creates new centers until it changes. The returned binaries then contain pixels in the first (positive) and second (negative) class according to this clustering.
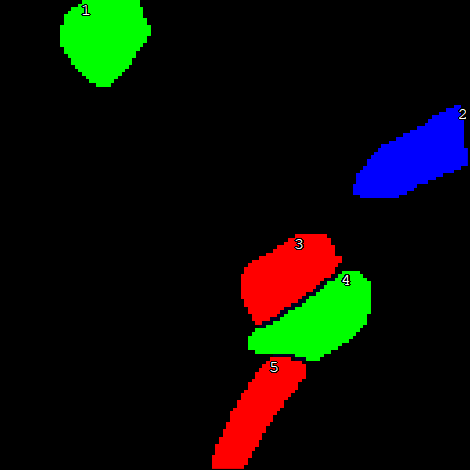
Connected color image is converted into a binary image. Touching color areas are separated into different binary objects.
Connected color image is converted into a 3D binary image. Touching color areas are separated into different binary objects.
Performs the segmentation of binary result using the tight borders detection.
Detects pixels with intensities higher than the specified threshold value. The higher the value the less objects are detected.
Deletes branches with length smaller than the length specified.
Connects free endings of the neighboring branches.
Objects with EqDia (equivalent diameter of a circular object) smaller than the defined value will be deleted.
Objects with their border stronger than the defined value will be kept.
Draws a rectangle ROI either by hand (use the  tool) or based on the defined position (X, Y) and size (Width, Height). Rectangle must be valid ensures that the drawn rectangle is not empty.
Opens a set of tools enablng to draw any objects into the current image.
 Draw rectangle
 Click and drag in the image to draw a rectangle.
 Draw square
 Click and drag in the image to draw a square.
 Draw circle
 Click and drag in the image to draw a circle.
 Draw Line
 Click and drag in the image to draw a line.
 Draw Polyline
 Click points in the image to define the polyline. Use the secondary mouse button or a double-click to place the last node of the polygon and close the object.
 Draw circle by defining 3 points
 Click three points in the image which will be placed on the perimeter of the defined circle.
 Fit circle into N points
 Click as many points you like and confirm the definition by the secondary mouse click. All the points are enclosed within the circle.
 Draw ellipse
 Click and drag in the image to draw a circle. Then click again on its edge and drag to create an ellipse.
 Draw ellipse defined by 5 points
 Click 5 different points in the image. The system automatically interpolates these points and finishes the ellipse.
 Draw polygon
 Click points in the image to define the polygon. Use the secondary mouse button or a double-click to place the last node of the polygon and close the object.
 Auto detect
 Click on an object in the image to automatically detect and draw its borders.
 Remove last object
 Deletes the object defined at last.
 Clear all
 Deletes all objects drawn in the image.
Transforms the source color image into the binary result with transformation programmed in JavaScript. Up to 6 color/binary/table inputs can be added.
See the dedicated documentation: Extending GA3.
 Segmentation
 Actual Range
 Full Range