Analysis definition with the source image can be downloaded here.
In this example GA3 counts the number of spots in each category determined by their position relative to the cell and nucleus (inside, outside, on the boundary).

Figure 691. Original image in color.
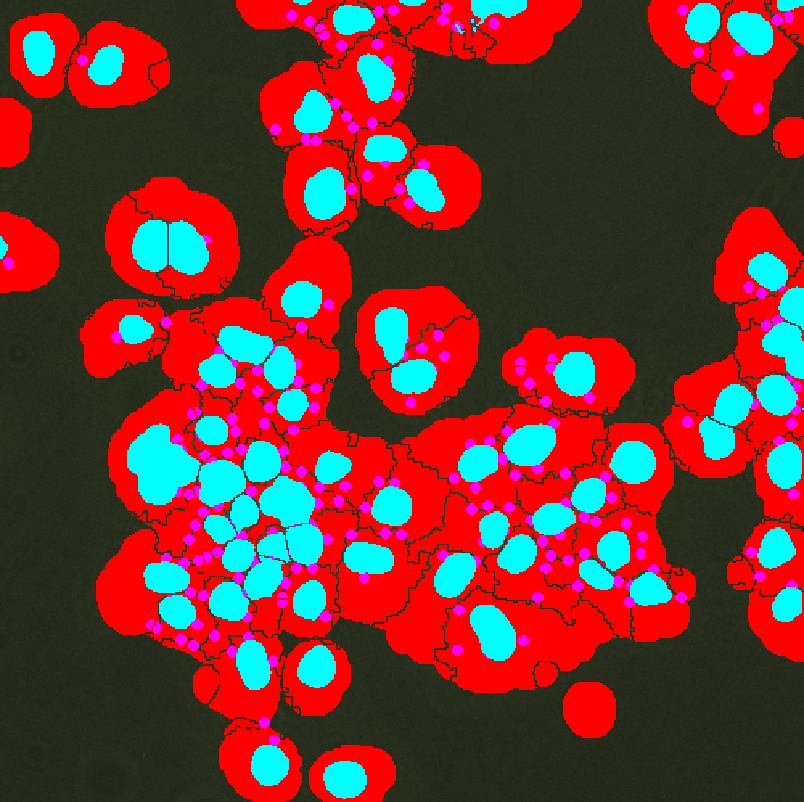
Figure 692. Source image showing binary layers (nucleus = blue, cell = red, spot = purple).
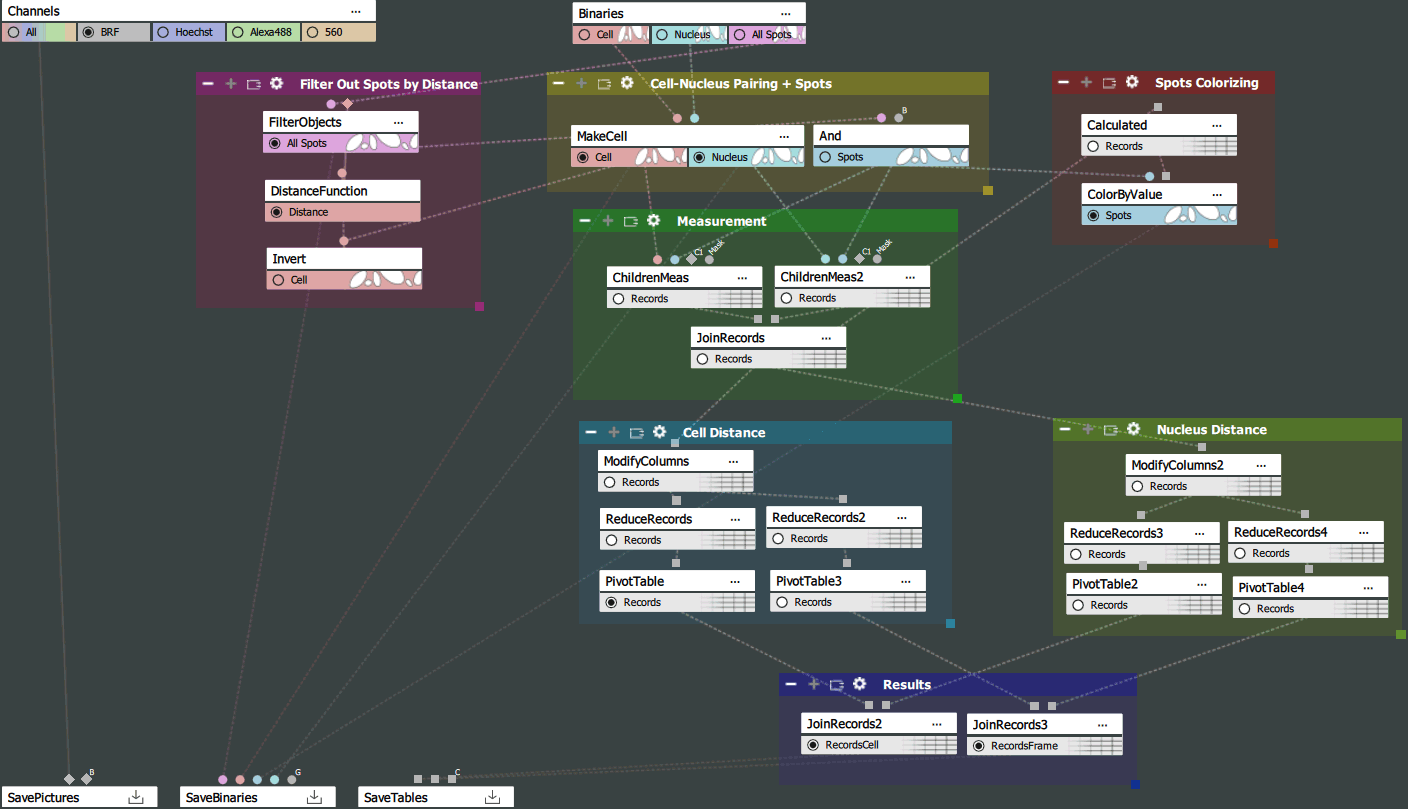
Figure 693. Analysis definition.
This analysis is split into 7 main sections:
Cell is defined using the Cell and Nucleus binary layers. Assigns one nucleus to each cell, discards nuclei without cells and cells without nuclei. Cell/Nucleus Area Ratio is set (this is useful when the nucleus is the same size as the cell or when the cell has a tiny nucleus). This node also paints (gives IDs) to the remaining cells and nuclei so that the cell and its nucleus have the same ID (they are paired).
The And node is technically redundant, but both ChildrenMeas and ColorByValue are connected to it and it defines a new binary “Spots”. If we want to make further modifications to the binary, we can just plug this And to the end and don't need to link anything else. For example we do not want to filter using FilterObjects, we can link this And directly to the “All Spots” input.
Filter Objects measures the average intensity (i.e. distance from the edges) on spots and discards those that are too far from the cells.
Distance Function makes a channel giving the distance from the edges of the “Invert”, i.e. we get the distance of the pixels from the cells.
Inverts creates an area without cells.
ChildrenMeas measures the distance of the spot from the nucleus/cells and the placement (inside, outside, both). The distance is measured from border to border.
JoinRecords merges the distance of the spot to the cells and to the nucleus.
Calculated generates the ID for coloring based on two columns.
ColorByValue recolors the binary layer according to the numbers from the column.
ModifyColumns hides unnecessary columns. When we remove a column we do not have to work with it in the PivotTable making the table more simple.
ReduceRecords is a combination of GroupRecords and AggregateRecords in one node. Records are always grouped by SpotPlacement therefore we aggregate and calculate statistics for each type separately. If interested in results per cell, perform grouping by CellId. In this case we are interested in the number of spots in each category and the average distance.
PivotTable results are in one column, but we want to split them into more columns according to the placement. Pivot will always split the count and mean columns into 3 columns according to the placement column. Therefore instead of one column CountOfSpotsId, we get three columns, one for each category (border, inner, outer).
The same as in the Cell Distance section but for the nucleus.
JoinRecords groups results for nuclei and cells together. The branch measuring the perFrame results are combined into one table. Branches measuring perCell results are merged into the second table.