Analysis definition with the source image can be downloaded here.
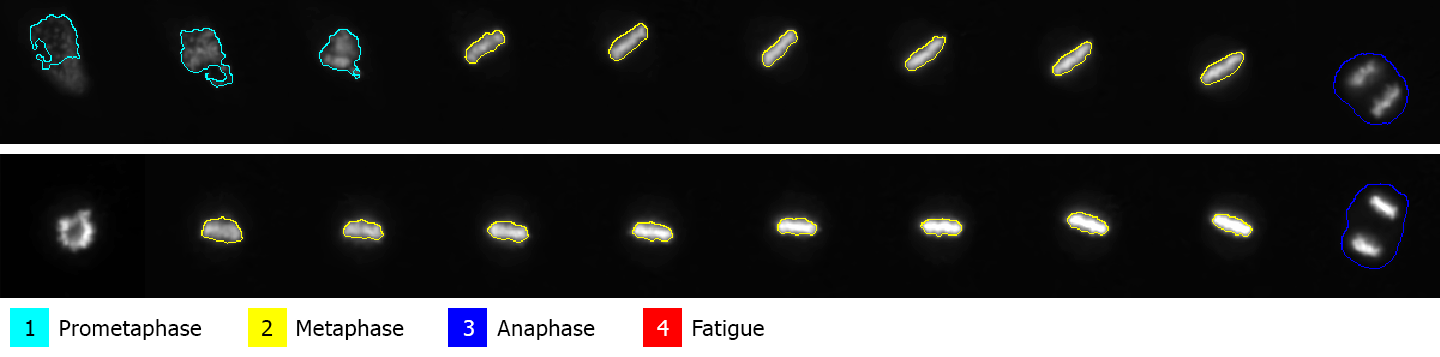
The NIS.ai module can be used for automatic cell classification using artificial intelligence. In this example four different cell stages were detected in our sample timelapse:
Prometaphase (second phase of mitosis),
Metaphase (third phase of mitosis),
Anaphase (fourth phase of mitosis), and
Fatigue (motionless cells with mitochondrial impairment).
Goal of the analysis is to detect and follow only the cells going through the mitosis process in the right order (prometaphase > metaphase > anaphase). Fatigue cells or cells with incorrect mitosis order should be automatically excluded.
The NIS.ai > Segmentation > Segment.ai produces four exclusive binary masks (classes). However, for subsequent tracking and processing it would be better to have one binary mask with a class property attached to every object.
Here are the four steps to be done:
Convert N class masks into a single one with the class attached to every object,
track all the objects,
fix and filter the tracks and
show the phases in the image.
All classified binary masks are converted to a color class image using ND Processing & Conversions > Labels & Classes > Binaries to Color. Every pixel has a value corresponding to the source binary (A -> 1, B -> 2, C -> 3, D -> 4) and 0 (zero) is for background.
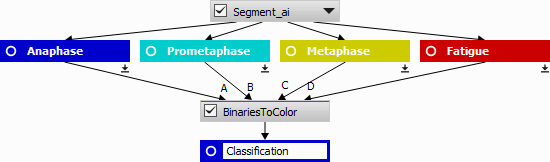
Figure 848.
Using Segmentation > Threshold > Threshold and Intensity Object Measurement (measures pixel values per object) objects with relative classes are obtained. After the threshold (especially when some binary postprocessing is used) the pixel inside the objects may not be of the same class. Therefore, the choice of the intensity feature is important. The Measurement > Object intensity > Mode returning the most frequent class is the most appropriate. Note that Mean and Median are not to be used here as they return a fractional number. In the present case it seems more approprate to bias towards the higher cell cycle phase - thus Measurement > Object intensity > Maximum is used.
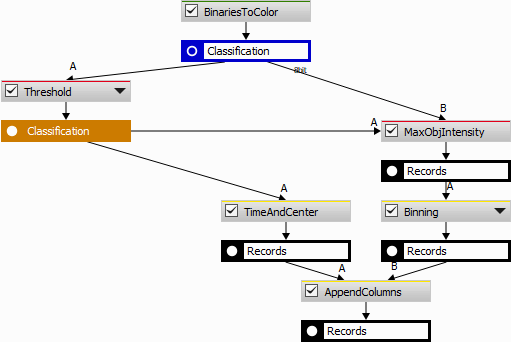
Figure 849.
Data management > Statistics > Binning is used here to map the class numbers into name labels.
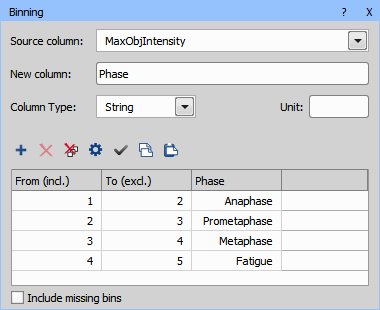
Figure 850. Binning node.
Tracking > Object Position > Time & Center is measured alongside for the subsequent tracking.

Figure 851. Appended data.
The table with centers and time is ready for tracking (Tracking > Tracking > Track Particles).
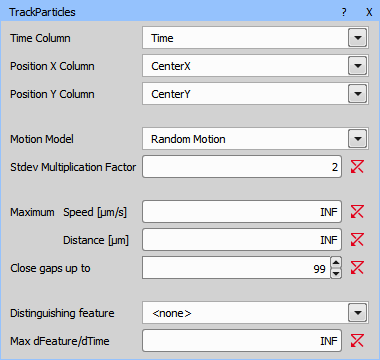
Figure 852. Track Particles node.
Then, tracking, renaming columns (“CellId”, “DetectedPhase”) and accumulating all tracked cells into one table (Tracking > Tracks > Accumulate Tracks) provides the following result.
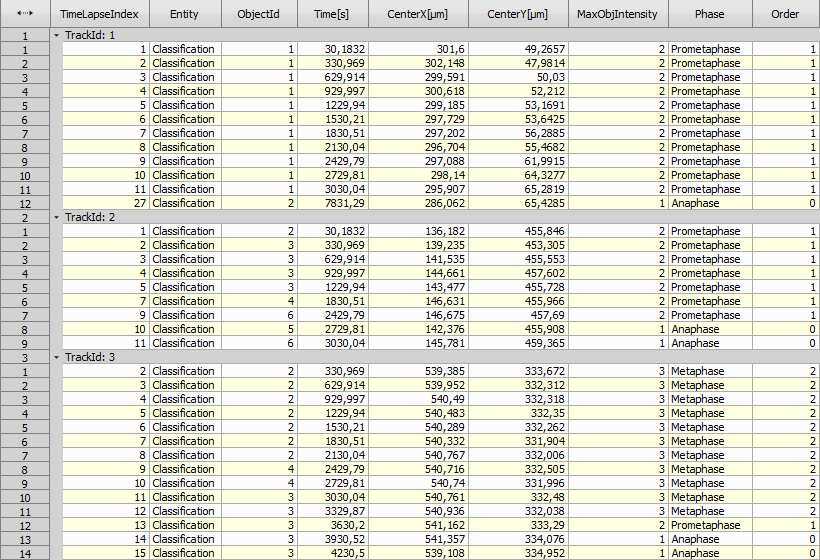
Figure 853. Accumulate Tracks results.
The AI “DetectedPhase” is sometimes wrong (not in the correct cell cycle order). The following JavaScript creates a new Column “CorrectPhase”, which is copied from the “DetectedPhase” if correct and left empty otherwise.
See the row 12 in “CellId: 3” showing the Prometaphase after Metaphase which is incorrect. The script therefore cleared all the incorrect phases leaving just one Prometaphase.
Note
the new value for “CorrectPhase” is returned
the column index “_5” is used via a variable (easy to change)
use of the “global” object to store the “lastPhase” and “hasFatigue”
resetting of “global” on the first row in group if (0 == ig)
// when new track Encountred set to Undefined (0)
var phaseColIndex  = _5;
var currPhase = a[phaseColIndex][i];

// cell is first time seen (ig = index in group)
if (0 == ig) {
  global.lastPhase = "";
  global.hasFatigue = 0 <= ag[g][phaseColIndex].indexOf("Fatigue");
}

// Fatigue <- was fatigue
if (global.lastPhase == "Fatigue")
  return "Fatigue";

// Fatigue <- is fatigue and was Prometaphase or Metaphase (we are more tolerant here)
if (currPhase == "Fatigue" && (global.lastPhase == "Prometaphase" || global.lastPhase == "Metaphase")) {
  global.lastPhase = "Fatigue";
  return "Fatigue";
}

// Prometaphase <- is Prometaphase and was empty
if (currPhase == "Prometaphase" && global.lastPhase == "") {
  global.lastPhase = currPhase;
  return currPhase;
}

// Metaphase <- is Metaphase and was Prometaphase
if (currPhase == "Metaphase" && global.lastPhase == "Prometaphase") {
  global.lastPhase = currPhase;
  return currPhase;
}

// Anaphase <- is Anaphase and will be "Fatigue"
if (currPhase == "Anaphase" && global.hasFatigue) {
  global.lastPhase = "Fatigue";
  return "Fatigue";
}

// Anaphase <- is Anaphase and was Metaphase
if (currPhase == "Anaphase" && global.lastPhase == "Metaphase") {
  global.lastPhase = currPhase;
  return currPhase;
}

// no change
if (currPhase == global.lastPhase) {
  return currPhase;
}

// if we got here it is wrong state
return "";
Then the objects with incorrect (empty) phases are filtered out.
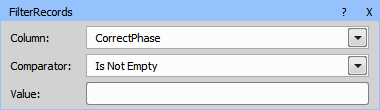
Figure 854. Filter Records node.
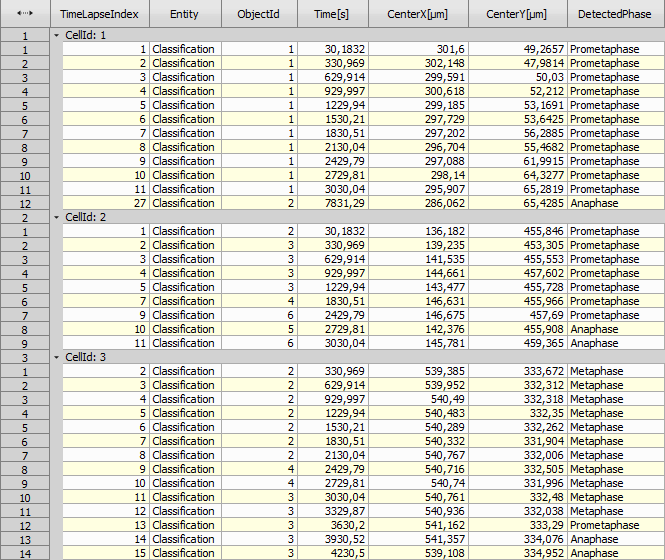
Figure 855. Modify Columns results tab.
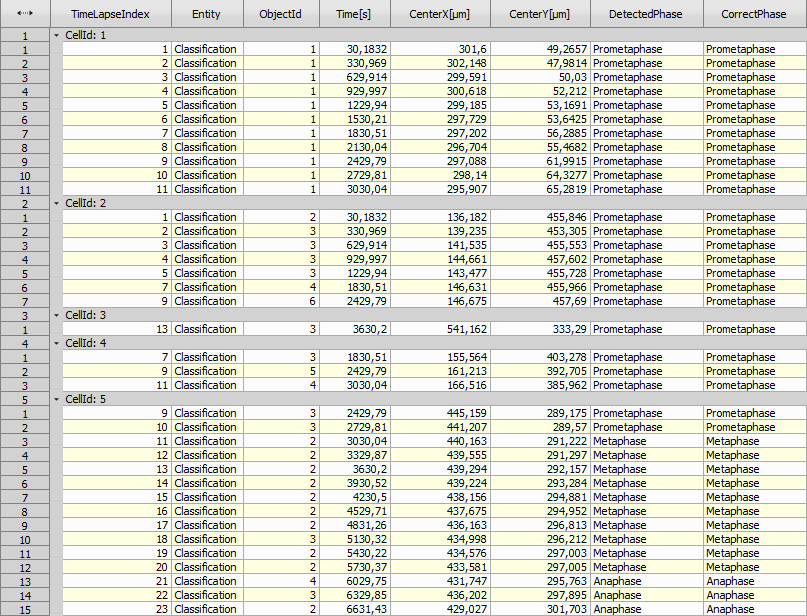
Figure 856. CorrectedCells results tab.
It is possible to extract lots of useful data from the table about the cell cycle but it is out of the scope of this use case.
Because the Binary processing > Colors & Numbers > Color by Value node does not support text it is necessary to convert the “PhaseNames” back to numbers using Data management > JavaScript > JS Create Column.
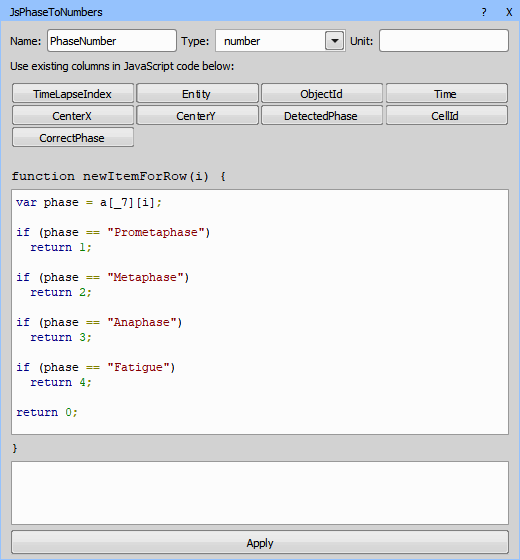
Figure 857. JS Create Column node.
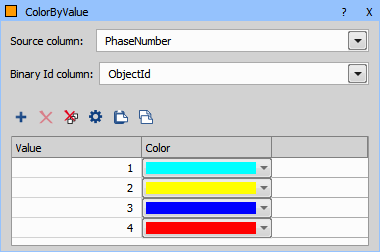
Figure 858. Color by Value node.
This is the final recipe:
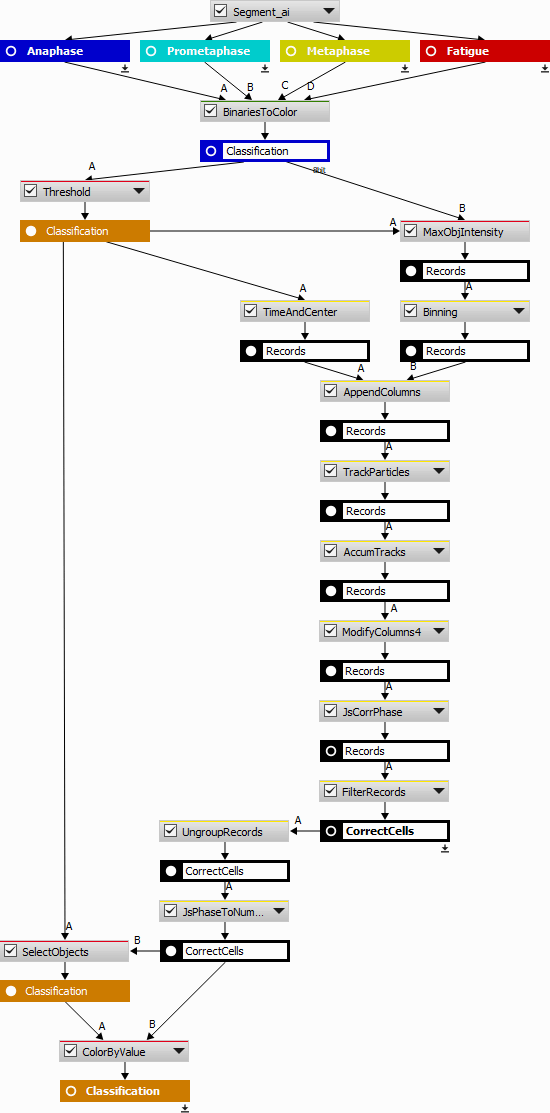
Figure 859. Complete general analysis.