 Sources & Reference
Source Image

Source Binary
Source Table
Merge Tables
Parameters
Import
Export
Temporary
Wizard
Save to Document
“xmin” - left edge
“xmax” - right edge
“ymin” - top edge
“ymax” - bottom edge
The “label” column is also mandatory and stands for binary layers name. The “prob” column filled with objects probabilities is optional.
Source table example:
Table 12.
tindex xmin ymin xmax ymax label prob 0 1025 360 1033 373 sperm 0.9998 0 366 478 372 491 sperm 0.9998 1 1186 351 1198 358 sperm 0.9997 1 250 9 263 18 sperm 0.9997 2 66 265 77 272 sperm 0.9995 FilenameSource table location.
LoopThe table dimension representation.
LabelThe desired label searched in source table data.
Minimum probabilityFilter for “prob” column (when present).
Rectangle/CenterSelects one of the binary layer types being loaded (bounding rectangles or centers of original binary objects).
an ordinary 2D dataset (row x columns) containing atomic datatypes or variable length strings,
a table previously exported using “Table to HDF5” (group of column datasets).
Append sequential number:
C:\seq00000.tiffAppend loop fields
C:\seq00000z000.tiffAppend sequential number:
C:\seq00000.svgAppend loop fields
C:\seq00000z000.svg
Inserts a single node with an overlay of all channels present in the current image.
Inserts a parental node with channels present in the source image. The channels can be selected in the drop-down menu.
Produces picture outputs representing both, the “All” channel composition and the individual channels.
Inserts a parental node with one channel selectable from the list of available channels (Selected) and the second channel with all the remaining channels together (Other).
Creates a new color image (channel) using the specified dimensions (Width, Height) and bit depth and fills it with the specified value.
Inserts all binary layers found in the source image and selected in the drop-down menu.
Inserts a parental node with one output containing the binary layer selectable from the list of available binary layers (Selected) and a second output with all the remaining binaries together (Other).
Inserts a binary node using a segmentation selected in the drop-down menu.
Inserts a table node showing the selected Result from the chosen Analysis and Module.
Loads the result table specified by the Result Name from database and appends the content of the connected table to it. When the result table does not exist, the connected table is set as the result. It is useful when some analysis (statistics, classification) has to be calculated over all runs, not just the current one. In such a case use the result R to perform the analysis on.
Name of the result table from database.
Sets the synchronizing rule for appending connected table's content (truncate when different columns / synchronize columns).
Adds extra columns for distinguishing analysis runs by Filename or Run Index.
Defines the folder used as an input. Click and select the folder.
Imports a binary/Global ROI from the specified nd2 file.
Loads a binary layer consisting of rectangular objects representing bounding rectangles or centers of original binary objects. The main purpose of this node is the visualization of objects predicted by AI nodes. Optionally the objects' probability can be taken into account and objects can be filtered according to it.
The source table is assumed to be accumulated for the whole dimension and the first column represents the dimension index. The following columns are mandatory and represent the bounding rectangles' positions in pixels:
Imports a table from a comma separated values file (.csv). A data type (number or text) is determined for every column. The header (if present) can force the column type and a specific column meaning. Following header syntax is recognized:
Name or Keyword [Unit] : Type
Any name except colon.
For special columns like _Entity, _ObjId or _ObjId3d.
Any unit. This is an optional item.
Is int for integer; number, real, double for real numbers and string, text for strings. This is an optional item.
Source table location.
Indicates that the first row is a header (not actual data).
Is used to delimit columns (comma “,” (default), tabulator “TAB” or semicolon “;”).
Loads a table from HDF5 file.
Table can be:
When the format is not recognized table is not loaded.
Path to the file containing the table.
Group or dataset in the file e.g. /Ga3Tables/Records.
Exports TIFF images to the specified folder with the given name. This action can be used for having a reference when GA3 is used more than once JOBS.
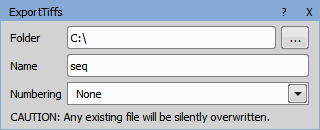
Figure 1035.
Path where the TIFF images will be saved.
Name of the TIFF files.
If numbering is set to None, a single file is created. This file is overwritten with every frame of the new data. This is useful for single frame or reduced files from the ND Processing nodes. The two other options create one TIFF file per frame:
Exports objects from the connected binary layer into .svg images.
Destination folder for saving the created file.
Created file name.
If numbering is set to None, a single file is created. This file is overwritten with every frame of the new data. The two other options create one .svg file per frame:
Sets fill opacity of the exported object.
Sets stroke opacity of the exported object.
Creates new nd2 file from cropped regions of the original one represented as a multipoint loop. Frames are ordered according to the selected column from the input table. Other loops (Timelapse, ZStack) are preserved.
Destination folder for saving the created file.
Created file name.
Suffix of the created files in case of saving to separate files (other loops than Timelapse and ZStack exist).
Column from the input table determining the cropped regions order in the resulting multipoint loop.
Column from the input table determining the center X of the cropped region in pixels.
Column from the input table determining the center Y of the cropped region in pixels.
Width of the cropped region.
Height of the cropped region.
Note
Preview creates a filename with a “Preview” prefix.
Exports the table into a .csv (Comma Separated Values) file.
Name of the file and the path where it will be saved.
Deletes the file content with each GA3 run.
Deletes the file content.
Stores a table into a HDF5 file.
Path to the file containing the table.
Group or dataset in the file e.g. /Ga3Tables/Records.
Sets whether the table is cleared before it is written to or appended.
Note
Preview creates a filename with “Preview” prefix.
Loads data previously saved with the Save Last node. The data is shared in the specified loop and kept private in other loops.
Name of the storage used to distinguish the temporary stores.
Loop where the data is shared (<none> to share in all loops).
Specifies the substitution when the storage is invalid (zero/max intensity/current image).
Saves the data to temporary storage. The data is shared in the specified loop and kept private in other loops.
Note
The B input must be connected to the Load node to ensure that it is executed before the Save.
Name of the storage used to distinguish the temporary stores.
Loop where the data is shared (<none> to share in all loops).
Loads data previously saved with the Save Last node. The data is shared in the specified loop and kept private in other loops.
Name of the storage used to distinguish the temporary stores.
Loop where the data is shared (<none> to share in all loops).
Specifies the substitution when the storage is invalid (empty/full/current binary).
Saves the data to temporary storage. The data is shared in the specified loop and kept private in other loops.
Note
The B input must be connected to the Load node to ensure that it is executed before the Save.
Name of the storage used to distinguish the temporary stores.
Loop where the data is shared (<none> to share in all loops).
Loads data previously saved with Save Last node. The data is shared in the specified loop and kept private in other loops.
Name of the storage used to distinguish the temporary stores.
Loop where the data is shared (<none> to share in all loops).
Specifies the substitution when the storage is invalid (empty/current table).
Saves the data to temporary storage. The data is shared in the specified loop and kept private in other loops.
Note
The B input must be connected to the Load to ensure that it is executed before the Save.
Name of the storage used to distinguish the temporary stores.
Loop where the data is shared (<none> to share in all loops).
Defines which channels (the connected ones) are shown in the wizard, whether autoscale LUTs is turned on and whether a pseudocolor is used for their visualization.
Defines which binary layers (the connected ones) are shown in the wizard, whether the object IDs are shown and how the binary layer transparency is set.
Defines which tables (the connected ones) are shown in the wizard.
Saves all connected channels into the result document. Connected inputs are synchronized by the “ToBeStored” property of the channel outputs present in the analysis.
Sources have to be added explicitly and the source node needs a GUI for channel mapping or binary selection.