Sometimes it is useful to be able to create all pairs from given objects and take only some of them. In this example, distances of the nearest holes (with the same diameter) are measured, put into histogram and color coded in the image based on their length.
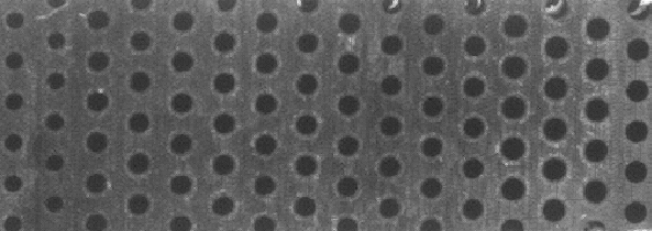
Figure 808. Original image.
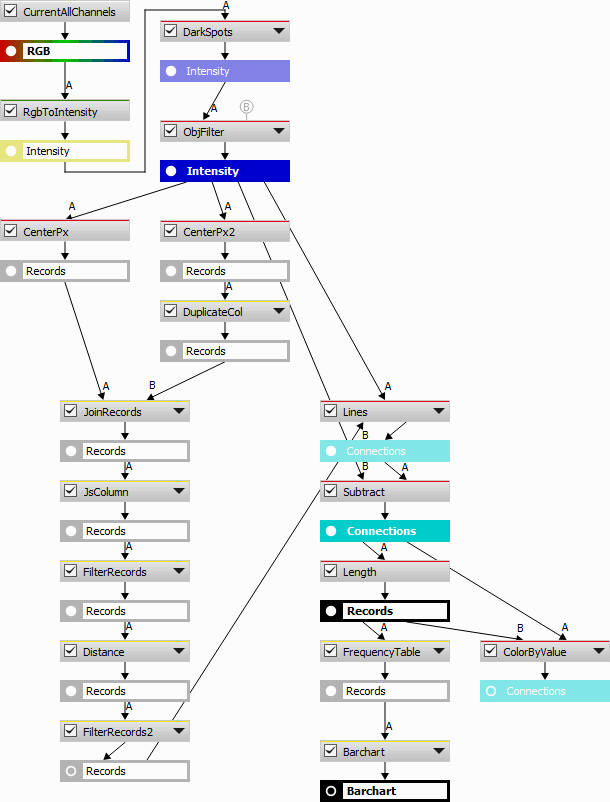
Figure 809. Analysis definition.
Join creates a Cartesian product of equal rows. Leaving the relation empty makes NxN rows from original N. We have to duplicate the “CenterPxX”, “CenterPxY” and “ObjectId” to have them coming from both A and B. It is more convenient to measure the “Center” twice and duplicate the “ObjectId”.
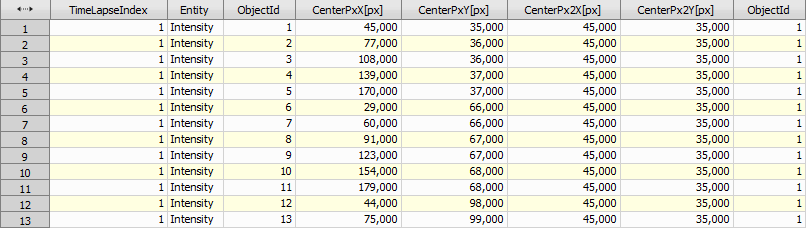
Figure 810. Joined Records.
Then the records have to be filtered to have only (NxN-1)/2 not to have the same pair twice (1-2, 2-1, 1-1). We want only the records where the first “ObjectId” is smaller than the second one. As the Filter node accepts only a constant we must use JavaScript. We create a new column which has 1 where first “ObjectId” < second “ObjectId” and 0 in all other cases.
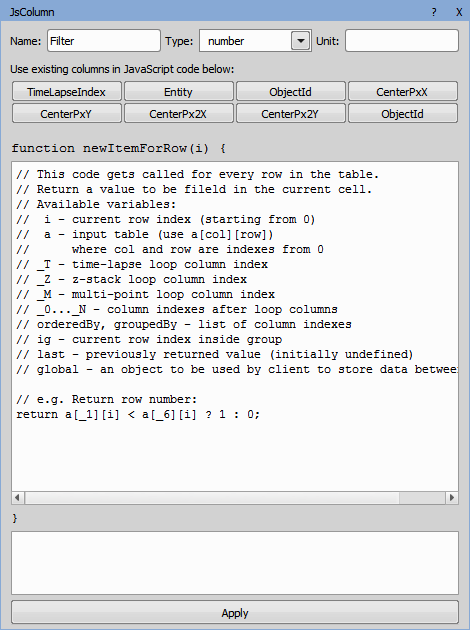
Figure 811. JS Create Column node settings.
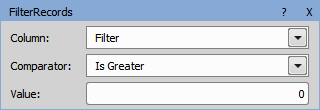
Figure 812. Filter Records node settings.
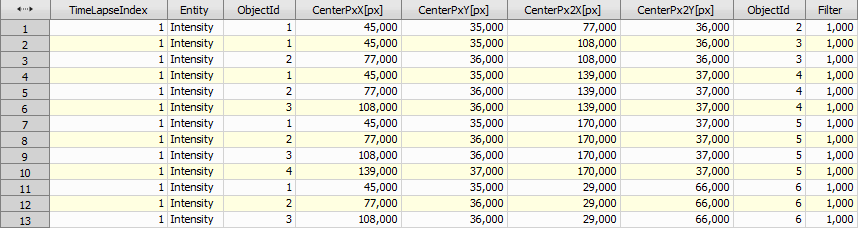
Figure 813. Filtering result.
Then we calculate the distance between [CenterPxX, CenterPxX] and [CenterPx2X, CenterPx2X] and filter out objects farther than a given distance.
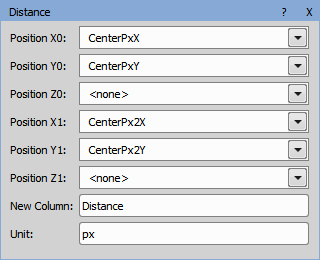
Figure 814. Distance node settings.
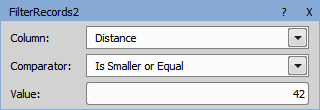
Figure 815. Settings of the second Filter Records node.
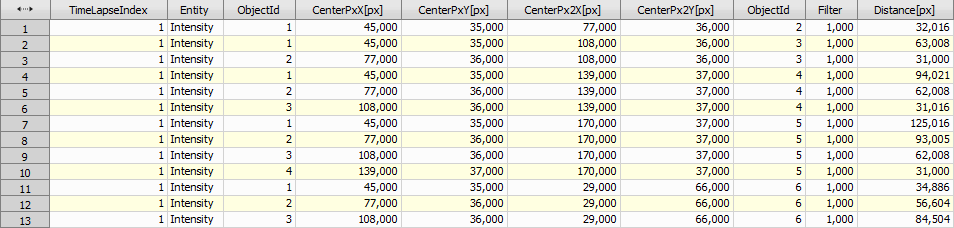
Figure 816. Result of the second filtering.
Now we insert lines: one per row so that [CenterPxX, CenterPxX] is the start point and [CenterPx2X, CenterPx2X] is the endpoint. We subtract the original spots and measure the length of these lines.
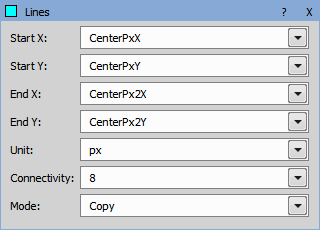
Figure 817. Multiple Lines node settings.
A barchart of a frequency table of lengths is created.
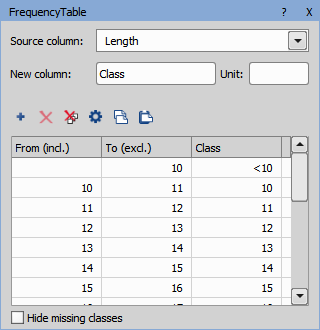
Figure 818. Frequency Table node settings.
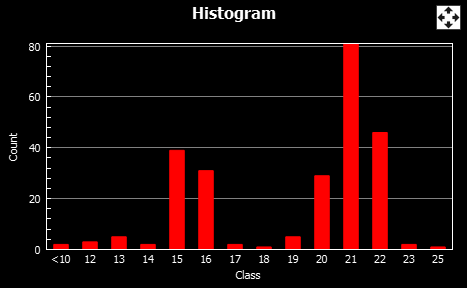
Figure 819. Barchart showing the distribution of distances between the nearest holes.
Note
First empty “From” cell is infinity. Last empty “To” cell means infinity.
And finally all objects are color coded.
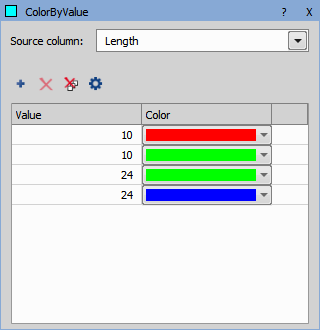
Figure 820. Color by Value node settings.
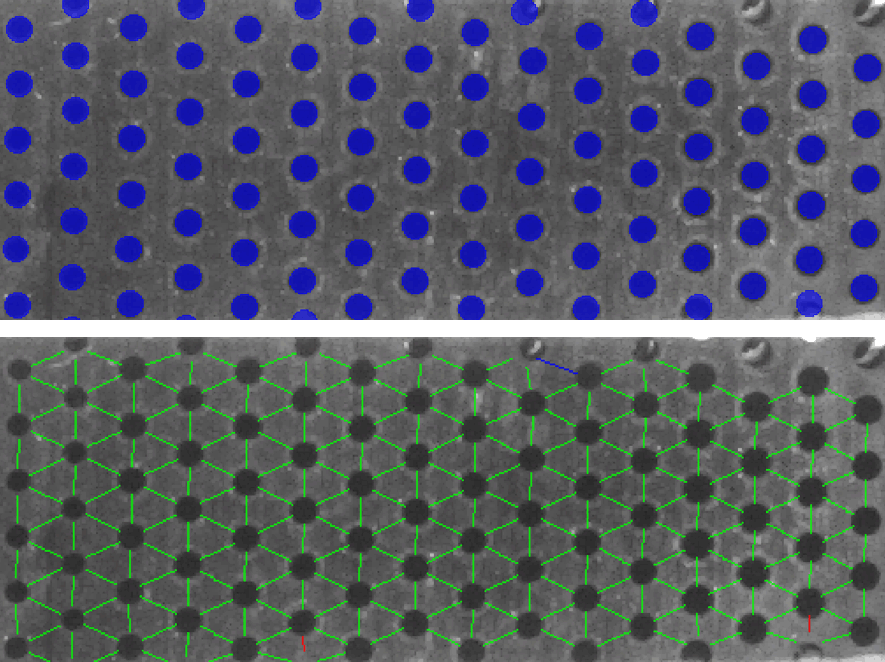
Figure 821. Detected holes (top image) and distances between the holes (bottom image) with a color code: green = correct distance, red = short distance, blue = long distance.