This example calculates features and statistics on Focal Adhesions (FA) – children object per cell (parent object). The features are typically cell features (e.g. Intensity, size...). Children features are aggregated into statistics (e.g. count of FA, Mean Intensity of all FA in cell, ...).
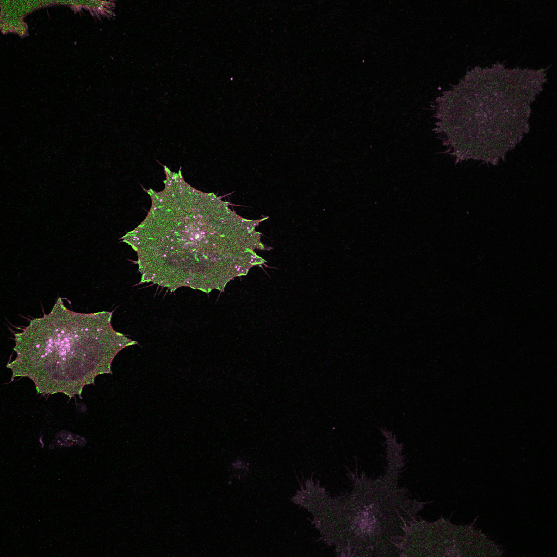
Figure 796. Original image.
As this task is quite common there is a dedicated node called Aggregate Children which takes two binaries and two tables for the parent and child. The node produces a table with aggregated columns as defined in the GUI and columns conveniently named after the binaries.
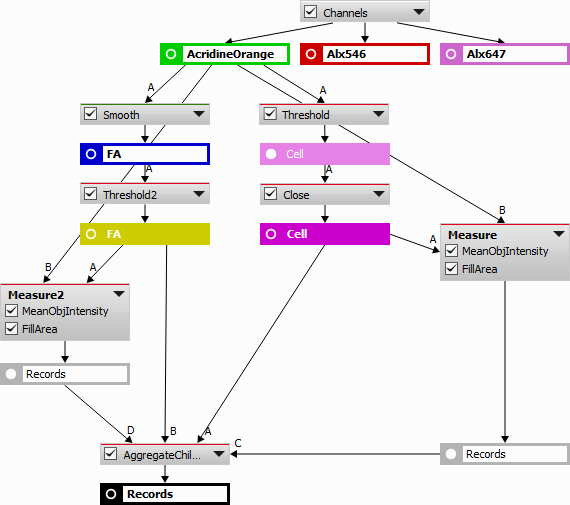
Figure 797. Analysis definition.
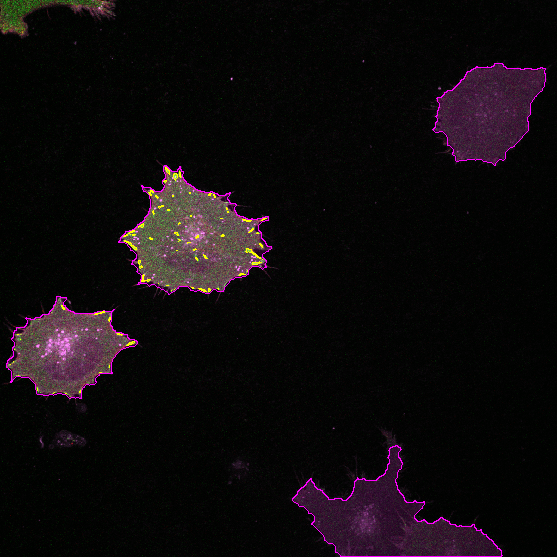
Figure 798. Detected FA (yellow) and cells (purple).
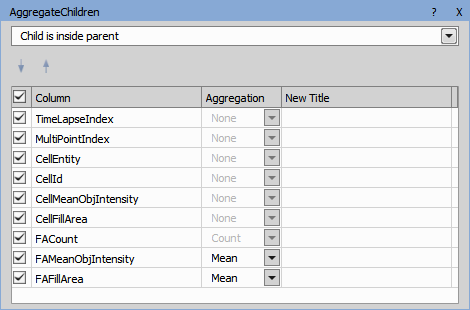
Figure 799. Aggregate children node settings.

Figure 800. Resulting statistics.
To get the brightest, biggest or nearest child and not the aggregation of children, there is a Children node in GA3 which outputs the table just before aggregation which is grouped by “ParentId” with all features.
In this example the biggest spots in cells are found.
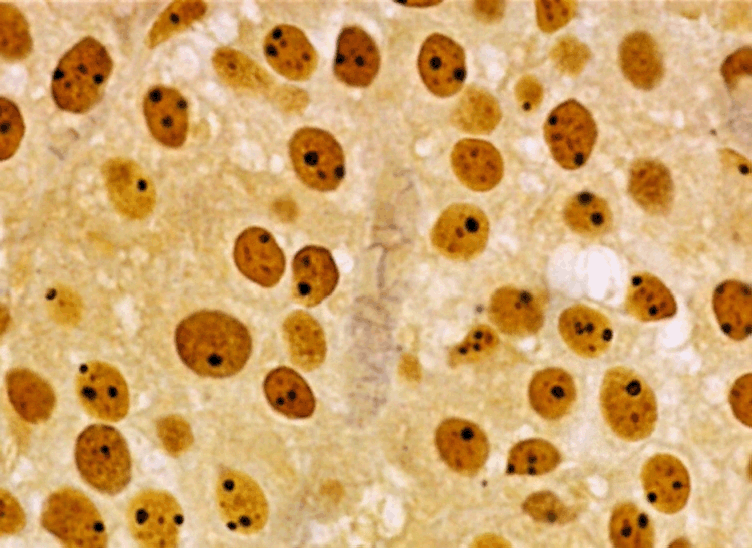
Figure 801. Original image.
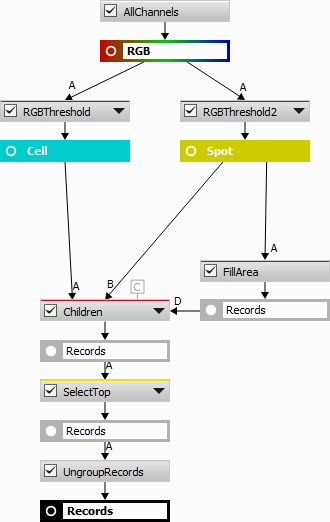
Figure 802. Analysis definition.
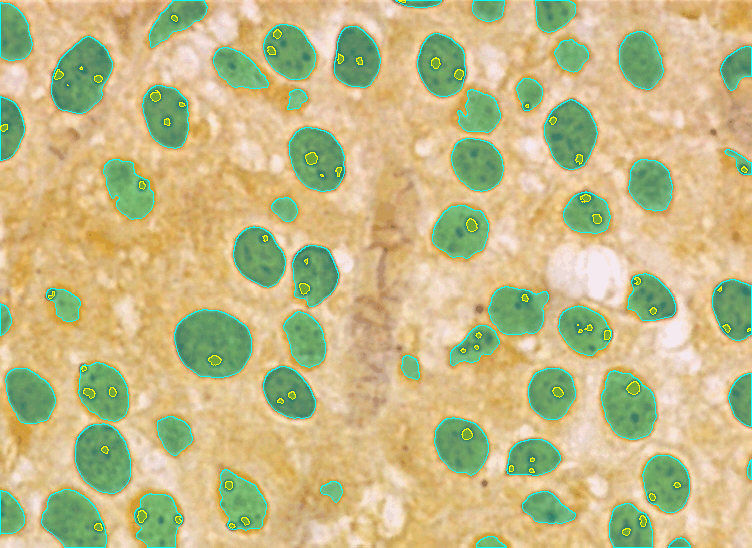
Figure 803. Detected cells (green) and spots (yellow).
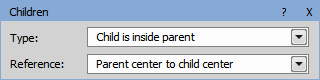
Figure 804. Children node settings.
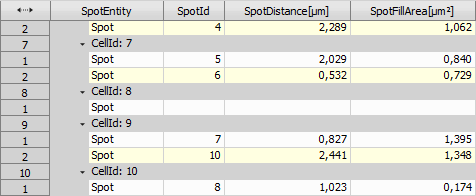
Figure 805. Result of the Children node.
The Children node outputs all grouped children. Select Top then takes only the biggest one.
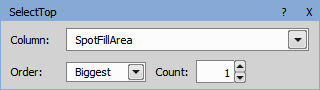
Figure 806. Select Top node settings.
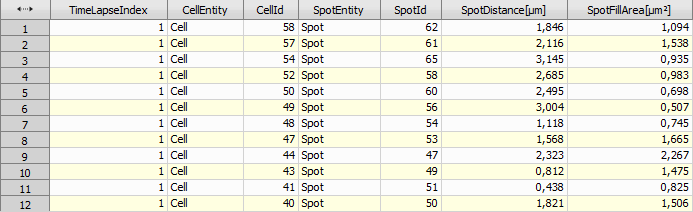
Figure 807. Select Top results after being ungrouped.
Note
A dedicated node Nearest Child (Measurement > Object parenting > Nearest Child) can also be used for this use case.