A simple histogram can be created using the Frequency Table node specifying the bins which are visualized by the Barchart node as shown in the following example.
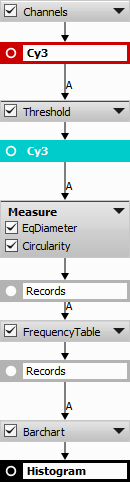
Figure 742. Analysis definition.
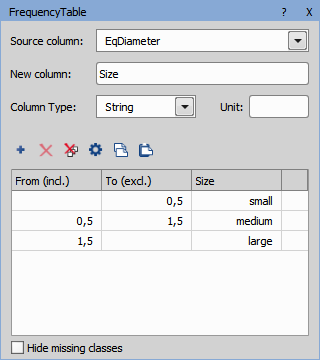
Figure 743. Frequency table node with empty “From” and “To” table cells representing infinity.
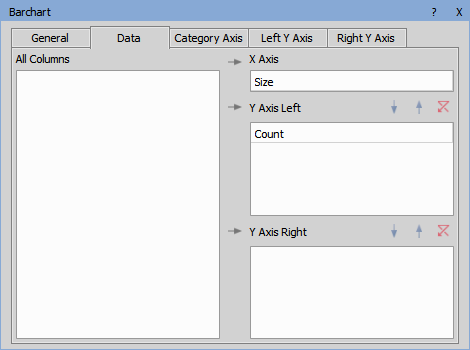
Figure 744. Barchart node.
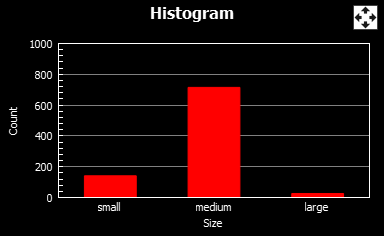
Figure 745. Resulting histogram.
To create a more complex graph combining multiple classified features, use the Binning node and other nodes present in the Data management group (see example below).
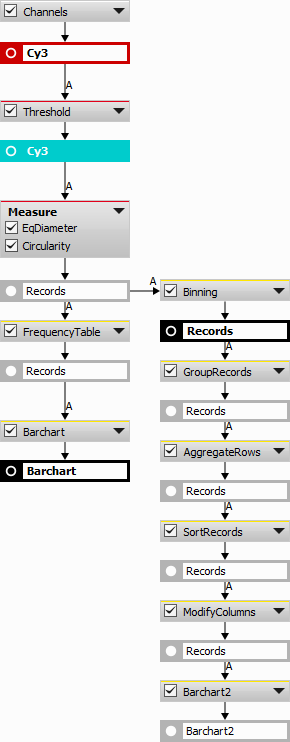
Figure 746. Analysis definition.
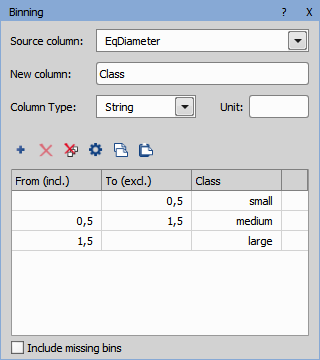
Figure 747. Binning assigns each row of the result into a bin (bucket) and creates a new column with the name of the bin.
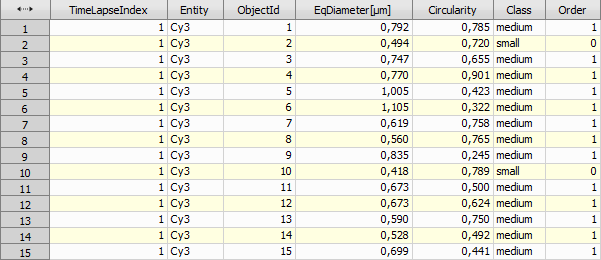
Figure 748. Results after Binning was applied. The “Order” column can be used for sorting the bins.
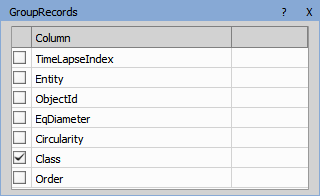
Figure 749. Group Records node.
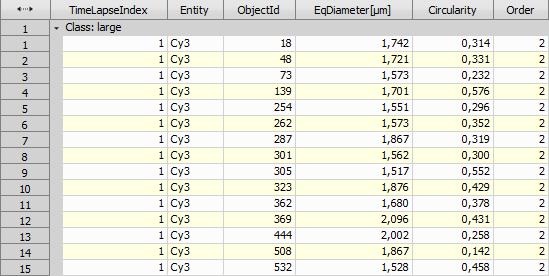
Figure 750. Results of the grouping.
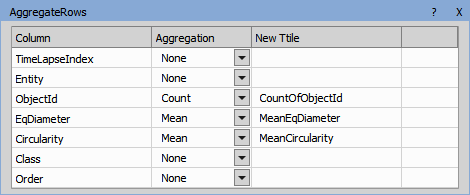
Figure 751. Aggregate Rows node.

Figure 752. Results of the row aggregation.
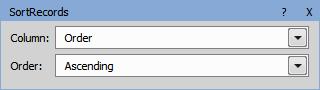
Figure 753. Sort Records node.

Figure 754. Results of the sorting.
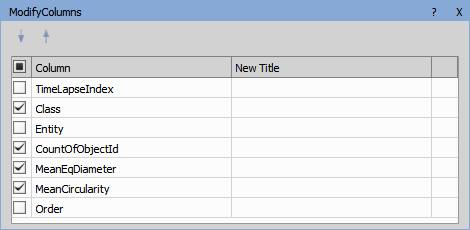
Figure 755. Modify Columns node.
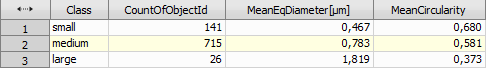
Figure 756. Results of the column modification.
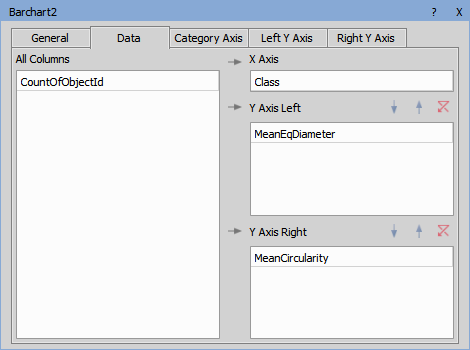
Figure 757. Barchart node.
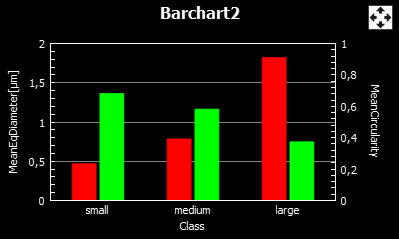
Figure 758. Resulting barchart displaying both MeanEqDiameter and MeanCircularity.