In this example, RMSSD (Root Mean Square of Successive Differences) beat-to-beat variable is measured on a timelapse sample of a zebrafish heart. This short-term assessment of the heart rate variability helps to indicate any arrhythmic events.
This analysis was created based on the published article Automatic Zebrafish Heartbeat Detection and Analysis for Zebrafish Embryos.
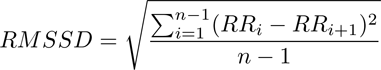
Figure 873. RMSSD formula, where RR is the interval between successive peaks.
Area which changes its intensity the most during each heart beat has to be selected first. The intensity peaks will only serve as an indicator of each heart beat for the timelapse table.
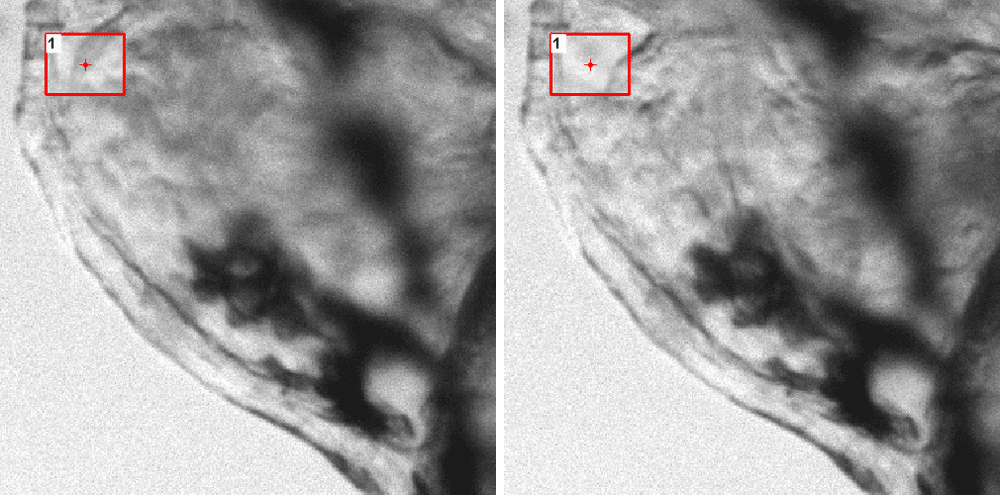
Figure 874. A rectangular ROI defining an area with intensity changes during the heart beat.
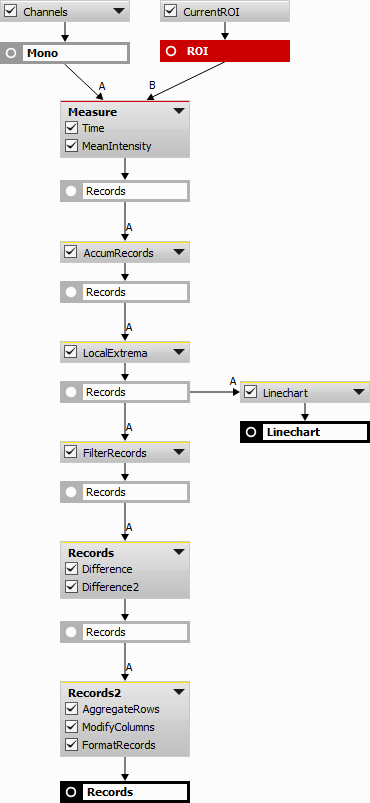
Figure 875. Analysis definition.
Time (Measurement > Field metadata > Time) and Mean Intensity (Measurement > Field intensity > Mean) is measured on the whole timelapse and the records are accumulated (Data management > Basic > Accumulate Records) to show the intensity for each measured frame.
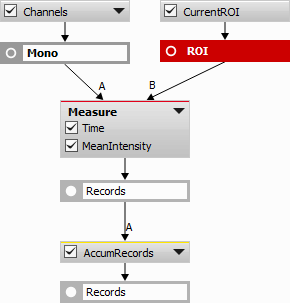
Figure 876.
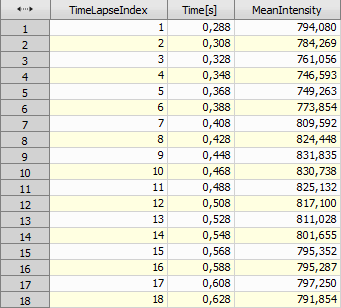
Figure 877. Time and MeanIntensity per each frame.
To get only the frames with heart beats, Find Local Extrema (Data management > Processing > Find Local Extrema) needs to be used, creating a new column including only Maxima and Minima of all the frames.
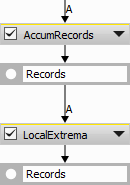
Figure 878.
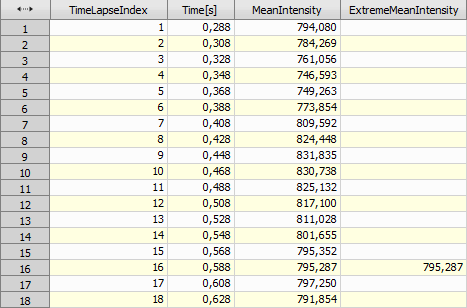
Figure 879.
Linechart graph (Results & Graphs > Legacy Graphs > Linechart) of the intensity in the selected ROI is created.
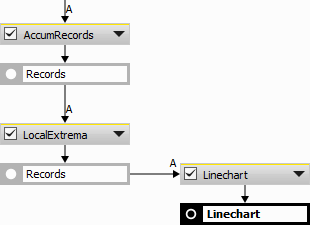
Figure 880.
“Time” has to be set for the X Axis and “MeanIntensity” and “MinMeanIntensity” have to be set for the Y Axis in the Data tab in order to visualize the following graph. Extreme values are visualized using yellow circles in the data series settings.
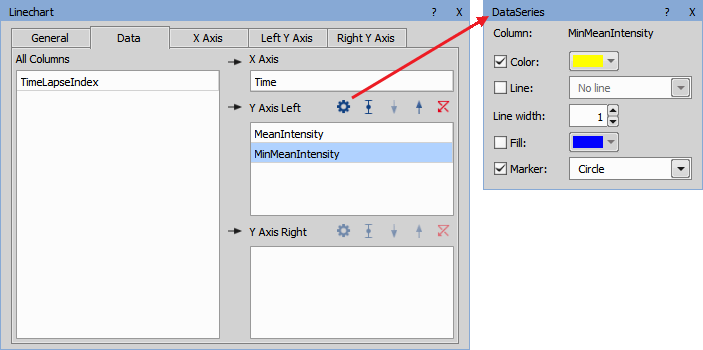
Figure 881.
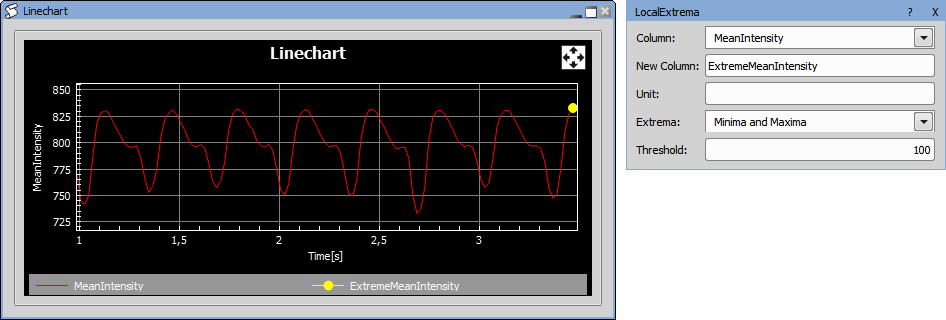
Figure 882. Too high threshold value.
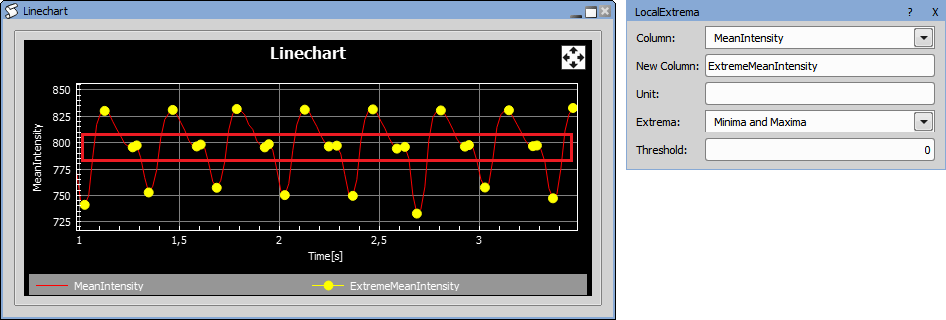
Figure 883. Too low threshold value.
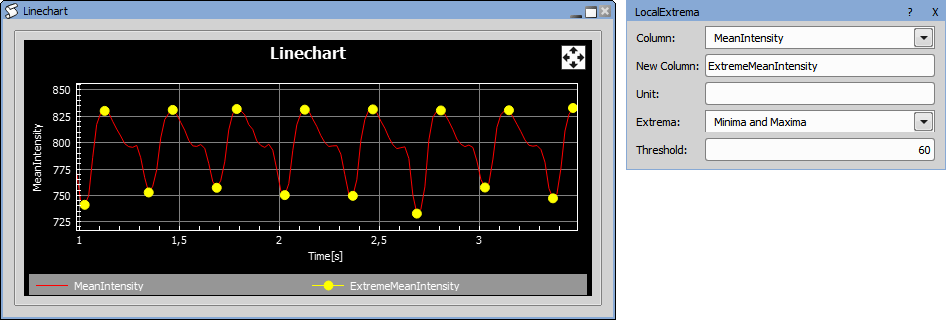
Figure 884. Fine threshold value.
The Threshold value is found using the line chart and only the “Minima” values are selected in the Local Extrema node as those represent the frames where the average intensity in the ROI gains the lowest levels (frame rate of the heart beat).

Figure 885. Graph showing the adjusted Extrema.
Filter Records node (Data management > Sort & Select > Filter Records) is attached onto the Local Extrema records and the “MinMeanIntensity” column is selected with “Is Not Empty” comparator.
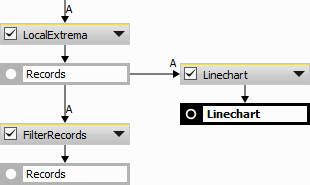
Figure 886.
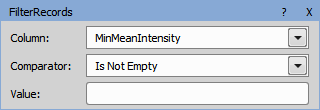
Figure 887.
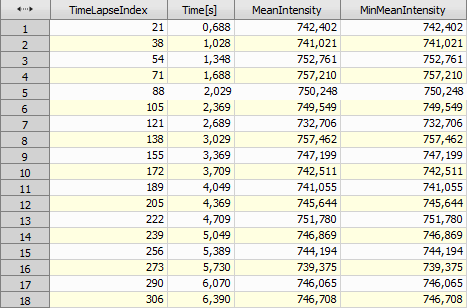
Figure 888. Minimal Mean Intensity results.
After adding Difference nodes (Data management > Sequences > Difference) with the following settings, all the differences between the Minimas (heart beats) and between the beat-to-beat intervals are calculated.
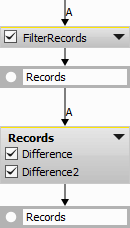
Figure 889.
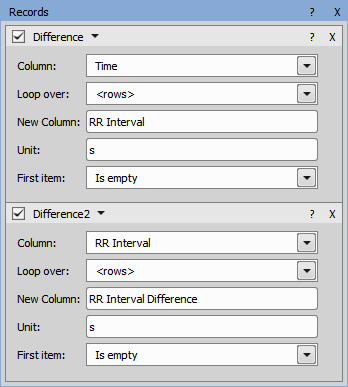
Figure 890. Difference node settings.
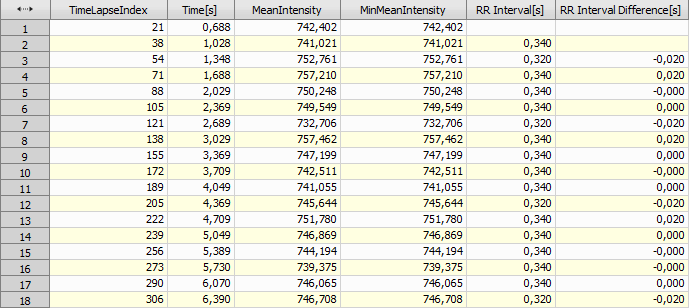
Figure 891. RR Interval and RR Interval Difference visualization.
Finally, RMSD is calculated using the Aggregate Rows (Data management > Grouping > Aggregate Rows), Modify Columns (Data management > Basic > Modify Columns) and format the records.
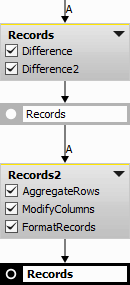
Figure 892.
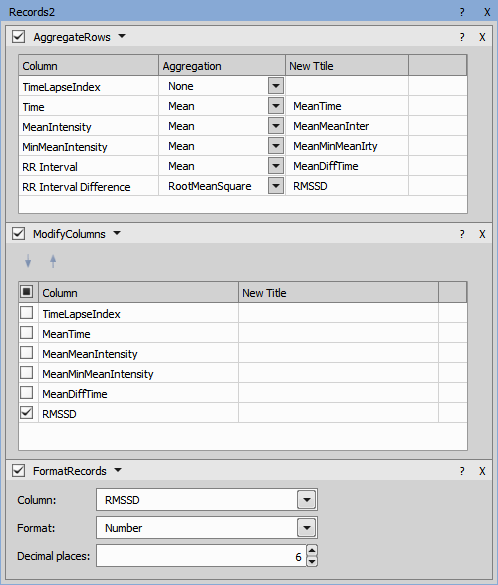
Figure 893. Aggregate Rows, Modify Columns and Format Records node settings.
Figure 894. RMSSD result.