This example shows how to recreate the analysis described in the article The NEMO Dots Assembly: Single-Particle Tracking and Analysis (Tinevez, Jean-Yves & Herbert, Sébastien, 2020) using General Analysis 3 tools.
Data for this example can be obtained here. There are multiple datasets, in our example we will use the Cell_02.tif file in the NEMO-IL1 folder.
Analysis definition with the source image can be downloaded here.
Time interval is 0.5s and the pixel width and height are 0.16 µm. Calibrate the dataset to match the specifications provided in this example (see Calibration).
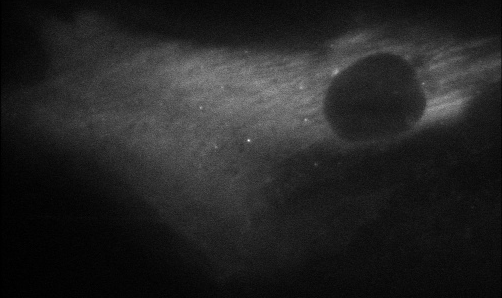
Figure 683. Original image.
Tracked particles in this example are bright spots on a dark background. If we look at the Maximum Intensity Projection in the image view, bright trajectories of these particles can be seen.
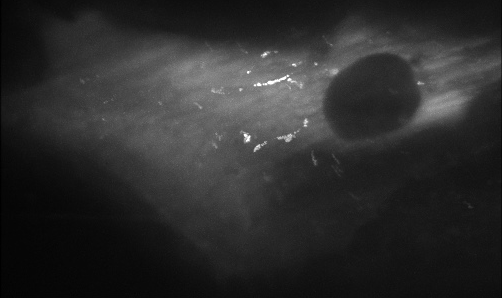
Figure 684. Particle trajectories highlighted by Maximum Intensity Projection (Max IP).
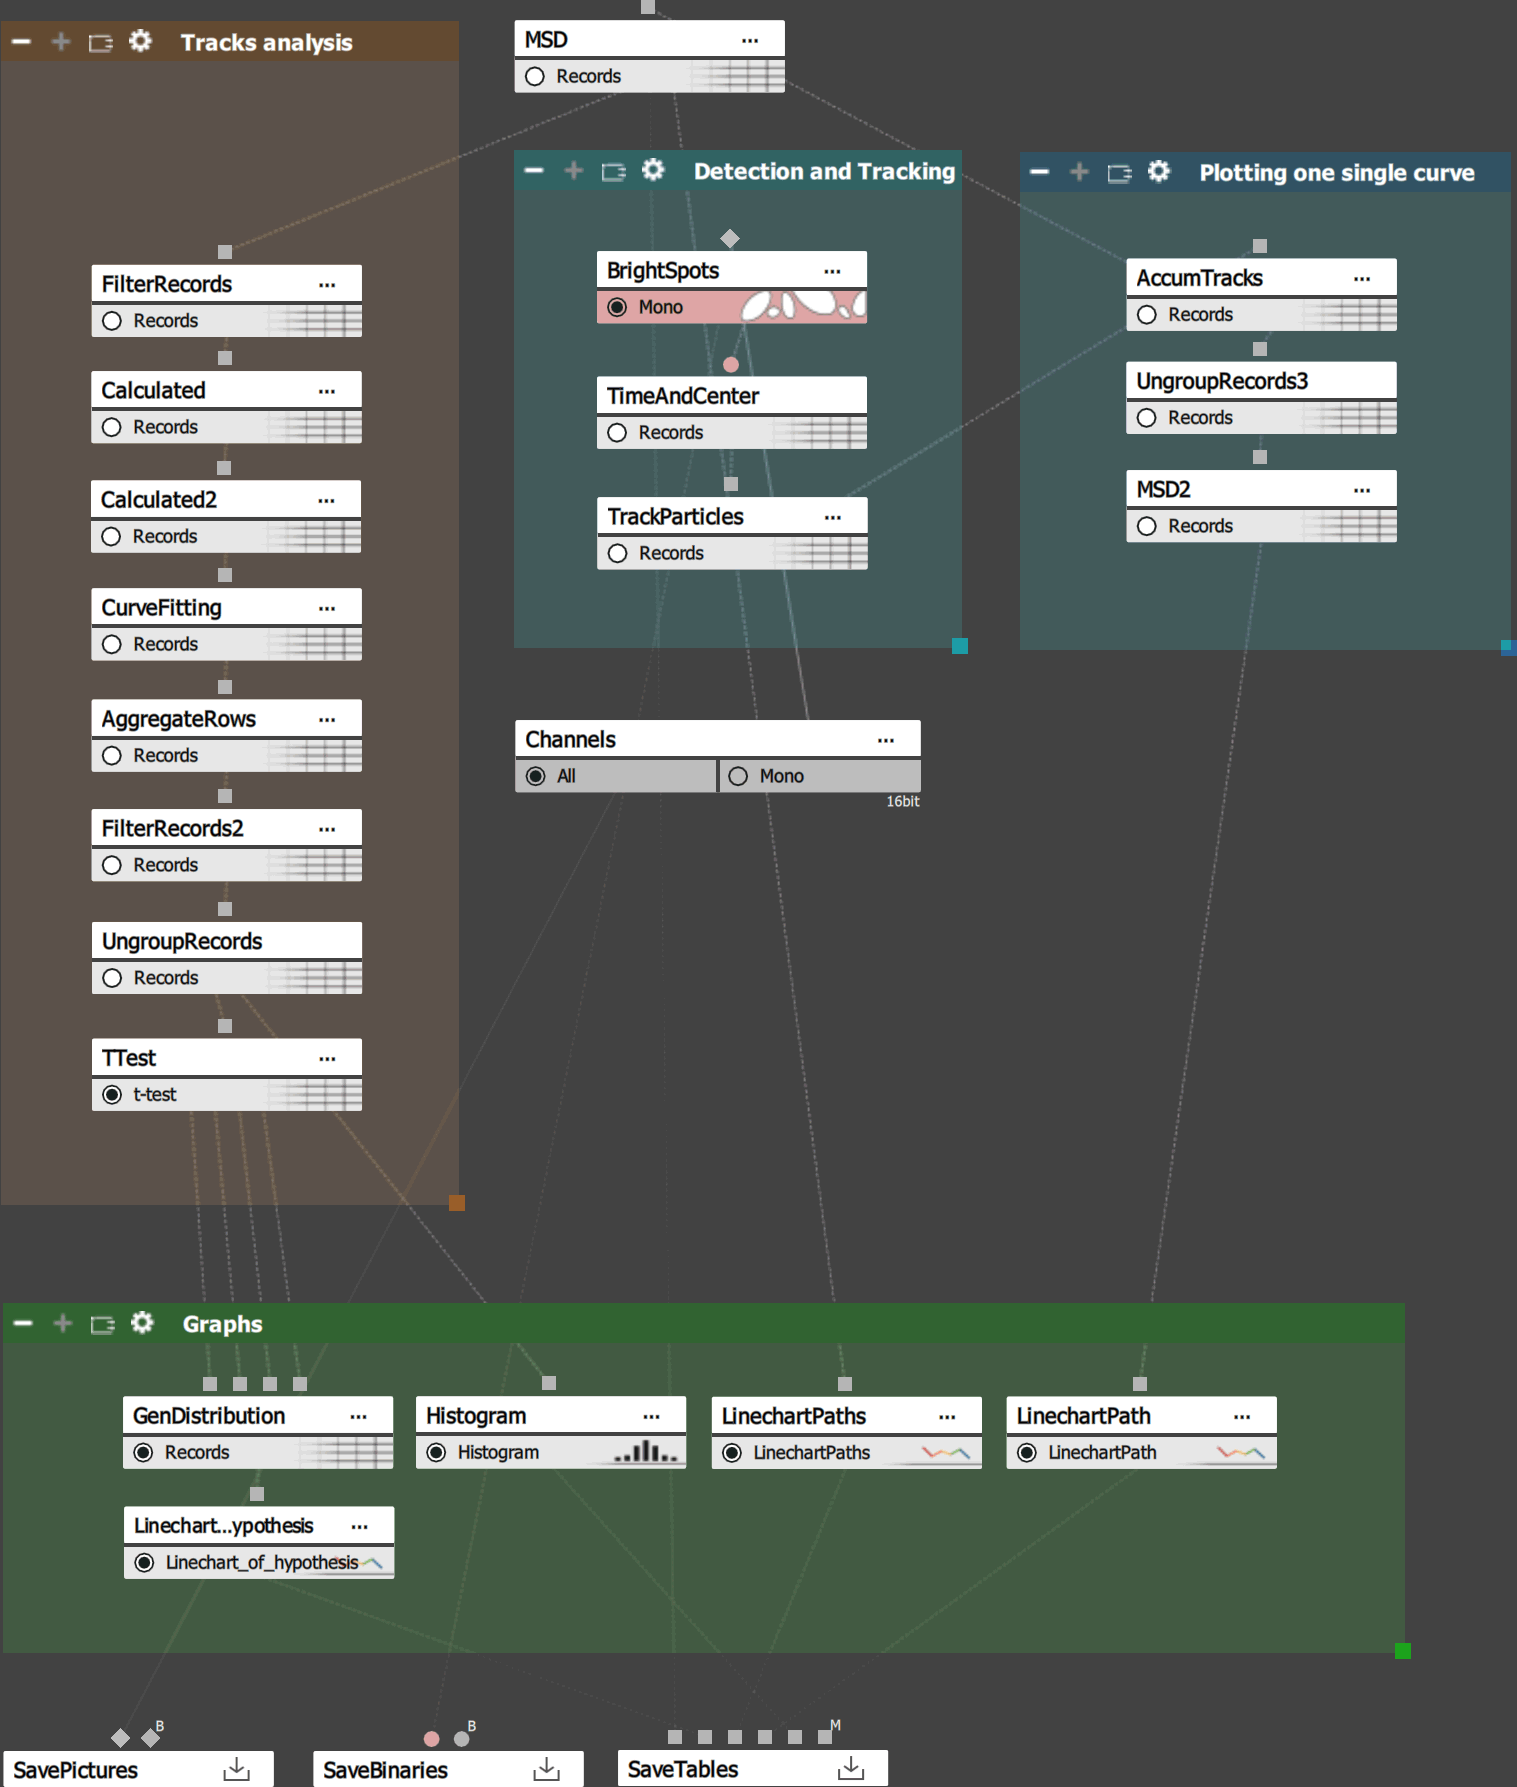
Figure 685. Analysis definition.
Our example has four main steps as shown in the analysis definition above:
Detecting and tracking particles between the frames.
Calculating MSD (Tracking > Tracks > MSD), data filtering and t-test to check whether the mean of slope “a1” could be equal to one.
Creating a line chart of the path.
Creating output charts including the hypothesis line chart.
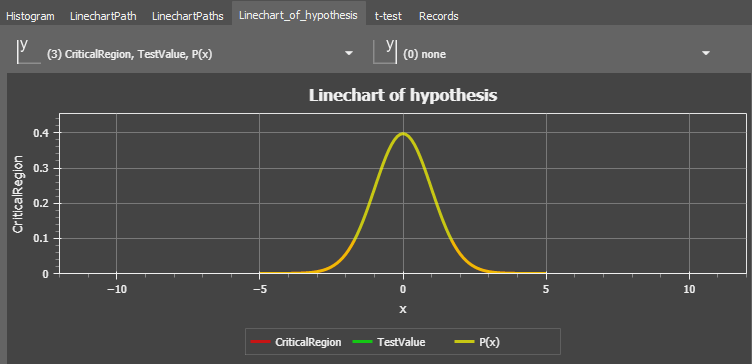
Figure 686. Hypothesis results.