
The Object Count tool is designed for automated object detection and counting. It enables users to threshold the image, automatically measure the binary objects, and export the measured data to a file in a straightforward way. Object count can be performed even on Live image. Run the  View > Analysis Controls > Object Count
  command to display the control panel.
The recommended workflow through the dialog is to move from left to right, starting with thresholding, then using restrictions and finally reviewing the result and export out of NIS-Elements to a text file or an MS Excel spreadsheet.
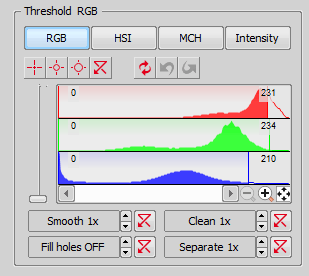
Figure 269.
The threshold limits shall be defined by picking object-typical colors from the image. Select one of the following tools:

1 point threshold tool

3 points circle threshold tool

6 points circle threshold tool
Click inside the image to define typical object areas. The system will detect similar parts of the image and highlight it by color. The threshold limits are indicated in the histogram and can be further modified by dragging the limit lines by mouse.
Please, refer to the Thresholding chapter for further details on thresholding.
The number of objects that are included in the results table can be restricted by defining limits. Objects which do not fit these limits will be left out of the result table.
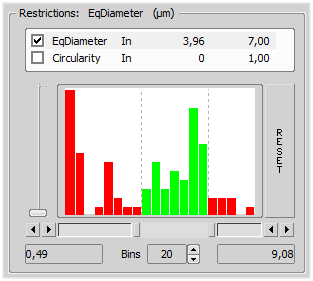
Figure 270.
Right click to the restrictions field to select one or more of the available measurement features.
Select the restriction feature you would like to define.
Move sliders below the histogram to set the limits. The limit values are indicated next to the feature name, and can be modified by double clicking the indicated value.
Decide whether the defined interval will be excluded or included - this is done by setting the Inside / Outside option next to the feature name.
The nearby check box indicates whether the restriction is currently being applied or not. If applied, the histogram below is color, otherwise it is gray.
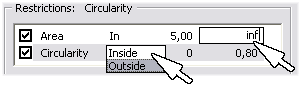
Figure 271.
Note
Infinitude can be defined by entering “oo” or “inf”.
This setting determines the number of columns in the histogram.
Restrictions from the Image
A reference object can be picked from the image and used to set the limit values.
Select the restriction feature you would like to set by mouse. Let's assume you have selected Circularity.
Right click the thresholded object which is going to be used as source. A context menu appears.
Select whether to INCLUDE or EXCLUDE the selected object and all others with higher/lower circularity.
The restriction will be applied and indicated by colors within the image.
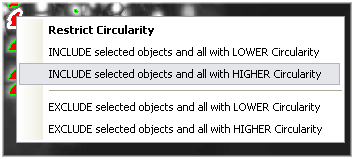
Figure 272.
The following results appear in the results table:
The area of the ROI. It is shown in square pixels or square calibration units.
The area of the binaries inside the ROI.
Number of objects after applying restrictions.
Measurement results for each object are displayed in this table. Select the columns to display/hide from the context menu which appears when you right-click one of the column captions.
Number of selected objects is displayed in the left part of the toolbar. One or more objects can be selected by mouse while holding the Ctrl or the Shift key.
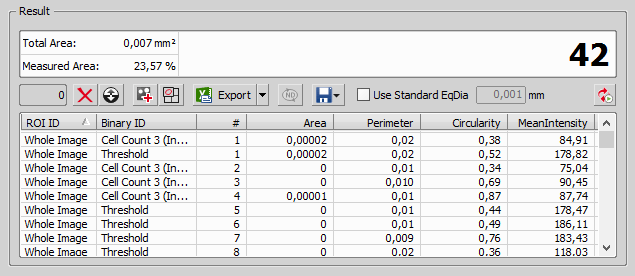
Figure 273.
Toolbar
There is a toolbar above the results table which contains the following buttons:
 Delete selected objects
 Removes the selected objects. The objects can be selected by mouse while holding Ctrl.
 Invert selection
 Generate binary
 Show Object Catalog
 Opens the Object Catalog control panel with data source automatically set to “Object Count”.
The measured data can be exported to clipboard or a file using the Export button. Please refer to the Exporting Results chapter for further details.
 Save Object Count configuration, Load Object Count configuration
 Invokes a pull-down menu which enables you to load/save the current object count settings from/to an external file (*.counting).
Check this option to enable counting of objects using standard EqDiameter . Value of the standard EqDiameter parameter can be edited in the field nearby.
Note
Please be aware that the number of objects calculated by this function is only an approximation and not an accurate count of objects.
Open the Object Count control panel by the
View > Analysis Controls > Object Count command.Threshold the image. Use the thresholding picking tools and click on the image to sample areas of interest. These pixels selected will determine what intensity/ part of histogram is considered accepted. The threshold will detect several specs or smaller objects such as noise or background. If desired, the Clean and Smooth filters will exclude smaller objects.
You can also measure using the defined region of interest (the
 button) or measurement frame ( the
  button). Check the options are properly set in the Measure > Options dialog window.
Apply restrictions. Select Area from the list of available restriction features. Use the sliders in the histogram to specify the lower limit and the upper limit. The lower and upper limit will update in the display.
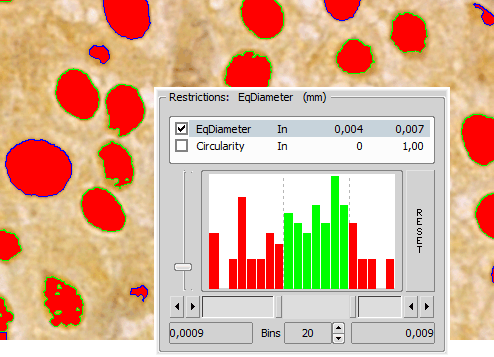
Figure 274.
The green area of the histogram represents the accepted range areas. Any object with an area in the green range will be considered an object. Alternatively, any object with an area in the red ranges will not be considered an object.
The outlines of objects on the image differ according to whether the object is restricted or accepted. In this case, accepted objects have a green outline and restricted objects have a blue outline.
To ensure that that count is updating with any change, click the
 icon.
icon.Remove any unwanted object from the object count by selecting the
icon from the Result section. The object will lose its thresholded overlay and will be excluded from the measurement.View the result data and export them to a file or spreadsheet application. See Exporting Results for further information.