
(requires: Time Measurement)
The time measurement tool records average pixel intensities within Regions Of Interest (ROIs) during a time interval. The measurement can be performed on Live camera signal or on a saved ND2 file. Before the measurement is started, regions of interest shall be defined and turned ON. When no ROI is defined, Time Measurement is performed on the whole image automatically.
Note
Time measurement is not supported for multichannel ND documents containing a Brightfield channel.
Run the  View > Analysis Controls > Time Measurement
  command to open the Time Measurement control panel.
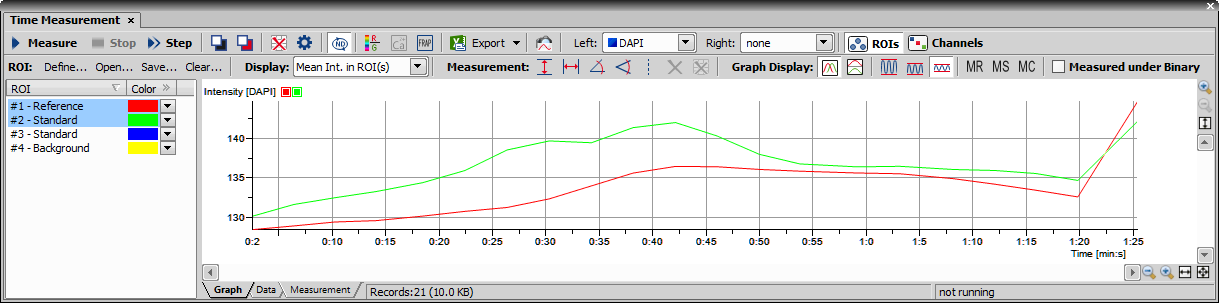
Figure 283. Time measurement window
The control panel consists of three parts: measurement tools, ROI definition tools and data display.
Enable the Measurement ROI by the
View > Layers > ROI command.Run the
Acquire > Live - Fast command to display the live camera signal.Define ROI(s) within the image. Time measurement will be performed under the ROI areas. Use the
ROI > Simple ROI Editor command or the Define toolbar button to open the vector ROI editor and use the ROI > Raster ROI Editor command to display the raster ROI editor. See Introduction to ROIs.Select a feature to be displayed in the graph using the Display drop-down menu.
Press the
 Measure button - the measurement will start. When the current ND document contains combination of time dimension with Z dimension or multipoints, press the
  Measure All button to measure all frames across all multipoints and/or Z stacks at once.
Export the results via the
 Export button. See Exporting Results for further details.
A snapshot of the graph will be created if you press the
 Create Snapshot button.

Note
If there are too many ROIs defined and the graph gets confusing, a single ROI (and the corresponding graph) can be highlighted. Right click the ROI name and select Bookmark ROI from the context menu.
Click  next to Color to reveal Mean and Maximal Intensity columns which are useful for filtering out ROIs/objects with insufficient intensity.
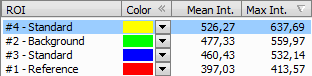
Figure 284.
Background / Reference Correction
The background or reference ROIs need to be on in order to use the following function. It is also crucial to place the ROIs over an appropriate area of the specimen representing background/reference area.
 Background Correction
 If the background ROI is definened, this button turns on the background correction (subtraction). Average intensity of the BG ROI is subtracted from all data being measured.
 Reference Correction
 If a Reference ROI is defined, this function corrects the measured data by a bleaching coefficient computed from the Reference ROI data. The Reference ROI should be placed over an “idle” area of the specimen where no action such as stimulation is taking place. The measured data of standard ROIs are then corrected in order to compensate the natural decrease of intensity during time. Please see Introduction to ROIs.
 Data Reset
 Press this button to clear measured data.
 Options
 Opens the Time Measurement Options window. See Options for detailed information.
 Run During ND Acquisition
 Press this button to switch on continuous time measurement during ND document acquisition.
ROIs Mode, Channels Mode
The ROIs Mode (show graph for each ROI) and Channels Mode (show graph for each channel) buttons in the top right corner swap between two measurement modes:
 ROIs Mode
 Multiple ROIs can be defined. In this mode, data for each ROI are available.
 Channels Mode
 In this mode, data for each color channel (averaged from all ROIs) are available.
Creating Meta-Data Graphs
The Time Measurement control panel can be used to create a graph of any meta-data included in the ND2 file - the temperature for example.
Graph Display
Use provided measurement tools to examine measured data. The following buttons adjust the displayed part of a graph:
 No Split
 The graph is not split.
 Split Horizontally
 Components defined in the Left and Right pull down menus are displayed separately in two graphs.
 0–Full Range
 Range of Y axis is set from 0 to maximal value of image bit depth (e.g. 255 for 8 bit image).
 0–Max
0–Max Range of Y axis is set from 0 to maximal value measured in the component.
 Min–Max
 Range of Y axis is set from minimal to maximal value measured in the component.
 Show memorized data,
  Memorize,
  Clear memory
 You can save the current graph to memory and display it later for comparison with another graph. Please see Graph Memorizing.
If checked, intersection of ROI(s) and a binary layer present in the image is measured. If no ROI is present, the whole image frame is considered as a ROI area defining the measurement extent. If the button is unchecked, any binary layers are ignored and the measurement is performed only inside the ROI(s). Choose one of the two states and click Measure.
Note
Note that when the binary layer is empty, the intersection is zero and measured data will also be zero.
Click the Options button. A dialog appears where you can specify the time measurement details:
General Options tab
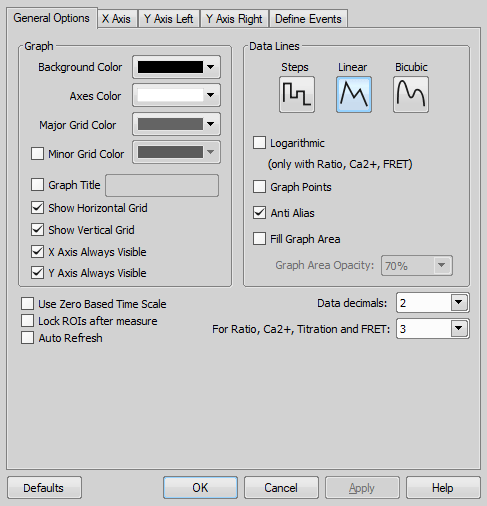
Figure 285.
Choose background, axes and grid colors from the palette. Check the Graph Title option to display a title, whose text you can enter in the adjacent field. Then check the Show Horizontal Grid / Show Vertical Grid items if you want to make them visible in the graph. If e.g. the X Axis Always Visible item is selected, the X axis does not leave the graph area while zooming in the graph.
Select interpolation method or drawing the graph lines by pressing the relevant button. You can choose Steps (rough), Linear (smoother), or Bicubic (really smooth) interpolation method.
Check to use logarithmic scale in the graph.
Check this item to display data points. Small dots indicating the actual data values position can be displayed on the graph line. The points appear only if the distance between them is big enough for them to be recognized (they usually appear when you zoom in the graph).
Turning this option ON will make the graph lines look smooth.
Check this item to fill in the area under the line chart with a color. Select the amount of opacity used from the list of predefined values.
Select one of two options:
If you select this option, displayed area of graph during measurement is fit to measured data.
If you select this option, displayed area of graph during measurement is fixed to defined values. Then define time range of displayed area of graph.
Select this option to ensure that the first frame of a time sequence will always start at 0.0s.
If checked, this function locks position of any ROI in the image after performing the measurement.
Measured data are automatically refreshed after any ROI change.
Define decimal precision of the results in the data table.
Define decimal precision of data in data table for ratio, calcium titration and FRET.
X axis
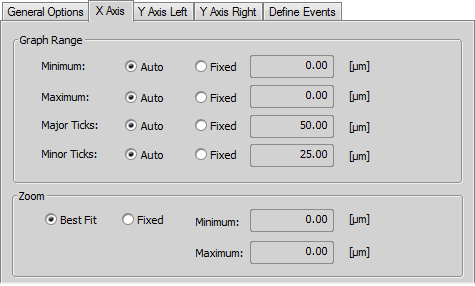
Figure 286.
Y axis left/right
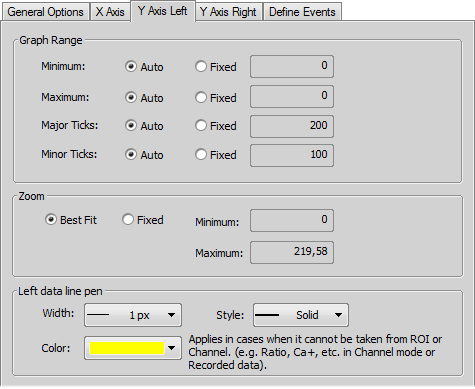
Figure 287.
The Graph Range and Zoom options are described above.
Set the line appearance - line color (in case color of image component is not set), thickness and style (solid, dot, dashed, dash-dot).
Define Events
This tab defines user hot keys which run special user events during time measurement. Simply click inside the Hot key field and press any key combination you want to assign to the event. Then you can enter the event description. Finally select or enter a command or a path to macro which should be executed when you press the defined hot key.
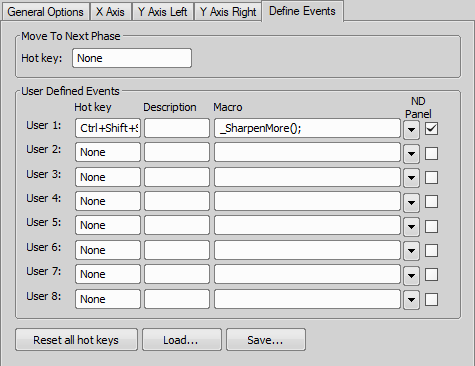
Figure 288.
For more information see Special Options.