
Figure 211.
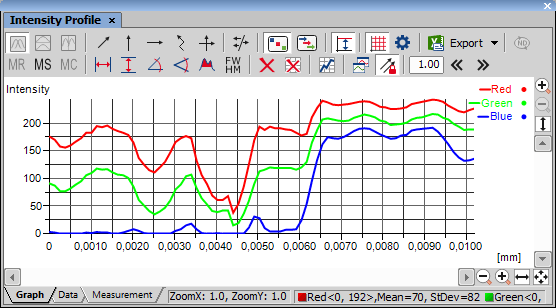
The following interactive measurements can be performed within graphs.
Click to the graph to define the maximum, then the minimum.
Half of this interval defines the value in which the graph width will be measured.
 Vertical,
  Horizontal
 Angle
Angle This tool enables selecting an angle and its both line lengths. The resulting number represents a ratio between the projection of the y arrow on y axis and projection of the x arrow on x axis. The resulting number is a dimensionless value. This tool does not allow adjusting the x line length.
 Free Angle
 This tool measures the same features as the previous angle tool but allows to adjust all of the angle's anchor points.
 Area under the curve
 This tool enables you to draw a rectangle in the graph. Area will be measured of intersection of the rectangle with the area below the graph curve.
 FWHM
FWHM This tool measures the Full Width at Half Maximum value on the given graph range.
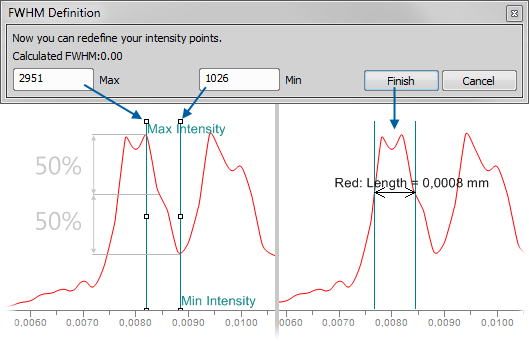
Figure 212.
Note
If the minimum is defined in a different part of graph (e.g.: different peak), the width is measured on the peak where the maximum value was defined.
 Clear Measurement Objects
 Reset Data