Manual Measurement


Performs the automatic object measurement. The segmented image (the current binary layer) is scanned and a set of size, shape, color and density features is measured. The set of features is defined by the Measure > Object Features command.
Note
If the measurement ROI or measurement frame are turned ON, or measurement restrictions are set, all these settings are taken into account.

Performs automatic field measurement.
Note
A set of size, shape and density measurements defined by the Measure > Field and ROI Features command is performed on a field.
See Also
Measure > Field and ROI Features, Measure > Perform Measurement
Enables you to select features to be measured. The description of each measurement feature can be found in the Measurement Features chapter.
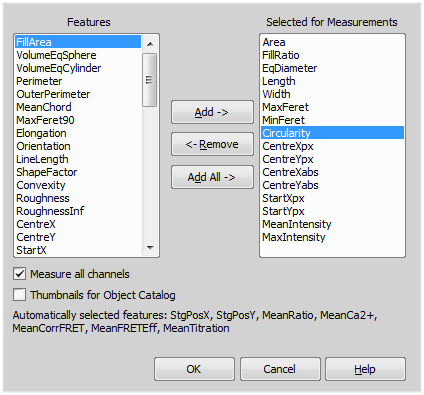
Figure 1896. Object Measurement Setup dialog window
List of object measurement features available in NIS-Elements.
Features selected for measurement are added to this list using and .
Adds the selected features from the Features list into the Selected for Measurement list.
Removes the selected features from the Selected for Measurement list.
Adds all available features to the Selected for Measurement list.
Check this item to measure the selected measurement features Min, Max, Mean, Sum on all channels instead of on one selected channel. Calculated channels as ratio or FRET will be measured as well.
Check this item to display the thumbnails in Object Catalog control.
After you click , first the low level function ResetObjectFeatures and then several functions SelectObjectFeature are called and appended to the list of executed functions. The number of SelectObjectFeature functions is equal to the number of selected features in the dialog box.
Enables you to define the field (textural) measurement. The description of all measurement features can be found in the Measurement Features chapter. The Field and ROI Measurement Setup dialog box appears.
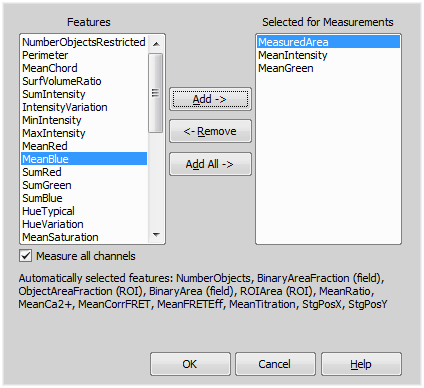
Figure 1897.
A list of features available for NIS-Elements Field measurement.
Features to be measured chosen by Add-> and <-Remove.
Adds selected features from the Choice window to the Selected for Measurement window.
Removes the selected features from the Selected for Measurement to the Choice window.
Adds all features to the Selected for Measurement window.
Check this item to measure the Mean feature considering all channels. Calculated channels such as ratio or FRET will be measured as well.
Confirm the selection and close the window.
This command defines custom measurement features. The Setup Custom Features window appears:
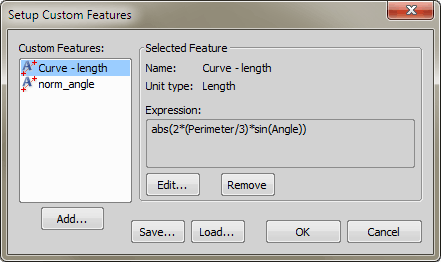
Figure 1898.
Contains a list of all custom created features.
Displays information about selected custom feature. Name, unit and expression that defines the selected custom feature are displayed.
Adds a new custom feature. Opens the Custom Features window.
Edits the selected feature. Opens the Custom Features window.
Removes selected feature from the list.
Saves current settings to an external file.
Loads previously saved settings from an external file.
Custom Feature Window
After you press the Add or Edit button, following window appears:
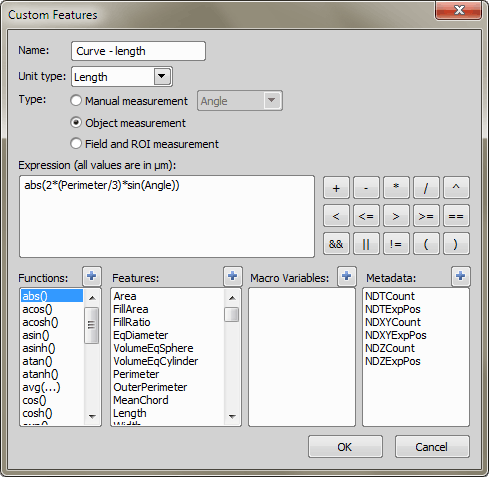
Figure 1899.
Enter the name of the custom feature.
Select what type of units is used to measure the feature.
Select for which type of measurement should be the feature used.
Select the type of manual measurement.
Defines a feature that is involved in object measurement.
Defines a feature that is involved in field and ROI measurement.
Enter the custom expression for calculating the feature.
Contains a list of available mathematical functions. Press the  button to add selected function to the expression.
Contains a list of available internal measurement features. Press the button to add selected measurement feature to the expression.
Contains a list of available macro variables. Press the button to add selected macro variable to the expression. The variable must be global, defined via user macro.
Contains a list of available metadata items. Allows to select ND global variables (number of counts and current count of time, multipoint or Z). Press the button to add metadata item to the expression.
Opens a window which filters measurement results according to the specified conditions.
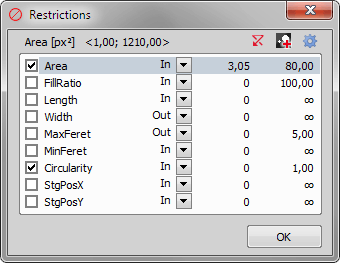
Figure 1900.
You can also set restrictions using the View > Analysis Controls > Restrictions  control window.
Name of the selected feature appears above the table. The current interval of possible values is indicated next to the feature name.
 Reset
Reset Resets changed value to default.
 Generate Binary Using Restrictions
 Creates new binary layer using the set restrictions.
 Select Object Features
 Selects the measurement features. The Measure > Object Features dialog box appears.
Creates a binary image with objects accepted by Measure > Perform Measurement command.
Note
Some objects are not involved in measurement because of lying out of the measurement frame, the measurement ROI image or the restriction interval, e.g. you can create a binary image that contains only circular objects, if you put restrictions on circularity feature. Performing this command, the GenerateBinary is called and appended to the list of executed functions.
Select two features to display and start clicking on the binary objects you want to inspect. Measured values of the clicked binary objects are added to the table.
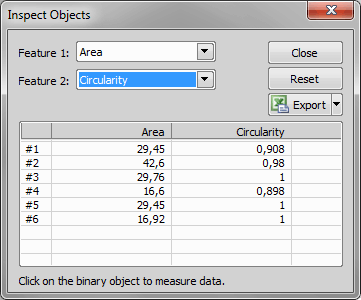
Figure 1901.
Select a measurement feature to be displayed in the table. You can change it anytime later during the inspection.
Closes the window.
Deletes all records from the list.
This button exports the table to an external file. Please see Exporting Results.

This command opens the View > Analysis Controls > Annotations and Measurements  control window and activates the tool which was last used. Each time a measurement object is drawn over the image, the measured values are appended to the results table. See Measurement Tools.

This command opens the View > Analysis Controls > Annotations and Measurements control window and activates the tool which was last used. Each time a measurement object is drawn over the image, the measured values are appended to the results table. See Measurement Tools.

This command opens the View > Analysis Controls > Annotations and Measurements control window and activates the Taxonomy tool. See Measurement Tools.

This command opens the View > Analysis Controls > Annotations and Measurements control window and activates the Counts tool. See Measurement Tools.

This command opens the View > Analysis Controls > Annotations and Measurements control window and activates the tool which was last used. Each time a measurement object is drawn over the image, the measured values are appended to the results table. See Measurement Tools.

This command opens the View > Analysis Controls > Annotations and Measurements control window and activates the tool which was last used. Each time a measurement object is drawn over the image, the measured values are appended to the results table. See Measurement Tools.

This command opens the View > Analysis Controls > Annotations and Measurements control window and activates the tool which was last used. Each time a measurement object is drawn over the image, the measured values are appended to the results table. See Measurement Tools.

This command opens the View > Analysis Controls > Annotations and Measurements control window and activates the 3D length tool. See Measurement Tools.
This command opens the View > Analysis Controls > Annotations and Measurements control window and activates the 3D angle tool. See Measurement Tools.
This command opens the View > Analysis Controls > Annotations and Measurements control window and activates the 3D polyline tool. See Measurement Tools.
(requires: Time Measurement)
This command displays the Time Measurement control window.
See Also
Time Measurement

(requires: 3D Measurement)
This window allows you to define the objects for measurement, displays various measurement features and allows you to export the results to Excel.
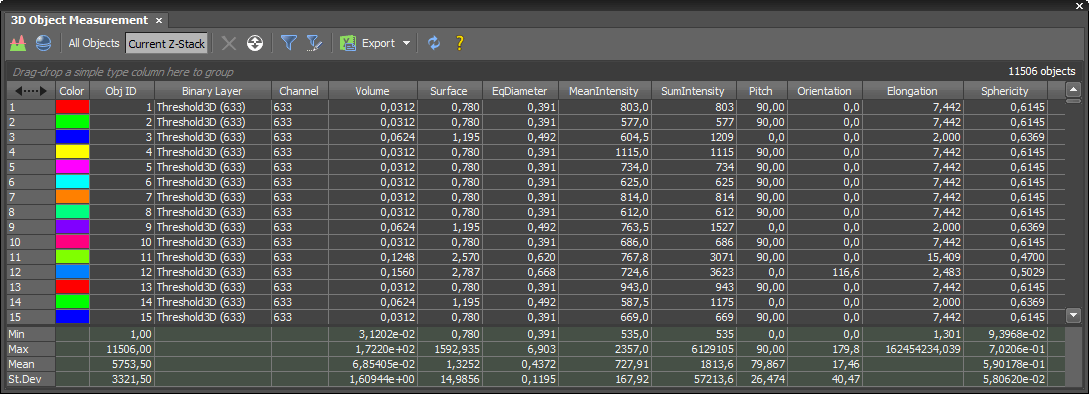
Figure 1902. 3D Object Measurement window

Enables interactive profile measurement. The Intensity Profile control window appears and the arrow indicating the profile cross section is displayed in the image.
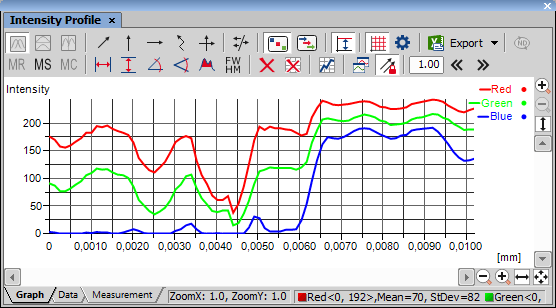
Figure 1903.
There are three tabs at the bottom of the Intensity Profile control window named Graph, Data, and Measurement. Switch from the default Graph tab to the Data tab. The number, X, and Y coordinates of every point of the profile is displayed there in a table. They can be exported using the Export button described below.
Some measurement actions can be performed within the graph. The results are written to the Measurement tab.
This option is enabled when the Multiple Profiles option is selected.
 No split
 Displays one graph view for all profiles.
 Split horizontally
 Tiles horizontally the graph view.
 Split vertically
 Tiles vertically the graph view.
One or more intensity profiles can be displayed together. A profile is defined by an arrow placed inside the image. There are the following profile modes:
Note
Context menu over the basic arrows allows you to reverse the arrow, switch it to full size or open the Profile Properties (see: View > Layers Properties > Profile Properties).
The profile line can be resized by dragging its ends by mouse arbitrarily. It is always a straight line
In this mode, the profile line is always in a vertical or horizontal direction.
This mode enables you to draw a free-hand (curve) or a polyline profile line. The existing profile line disappears and the cursor changes. Draw a curve or define a polyline by placing node-points to the image by single clicks. A right click defines the last point and finishes drawing.
This mode displays two straight mutually perpendicular profile lines composing a cross. The cross can be resized and rotated. The zero value of x-axis is in the centre of the cross.
If you switch from the single-profile mode to the multi-profile mode, a copy of the current profile line is created. Additional profile lines can be added by the Add Profile Line command from the context menu. Multi-selection of profile lines can be made holding Ctrl - the selected profile lines are indicated by a framed number.
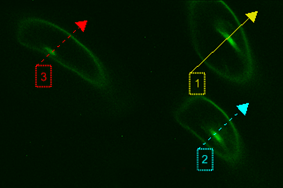
Figure 1904.
“Resize” and “move” operations are applied to the selected profile lines.
 Channels Mode (shows graph lines in channel colors)
 Graph lines use color of the original channel.
 Lines Mode (shows graph lines in profile line colors)
 Graph lines use color of the intensity profile arrow.
 Vertical Autoscale
 Optimizes the displayed graph area. If the measured intensities do not reach maximum values, the top part of the graph is hidden.
 Show Graph Grid
 Displays a grid in the background of the graph.
Profile Options Displays the options window. See View > Layers Properties > Profile Properties.
 Export
 Click this button to display a pull-down menu. The Graph image, graph data, and the measurement results can be exported. See Exporting Results.
Note
If the document is calibrated, all the exported values are in the calibrated units instead of the pixel values.
 Export ND profiles
 This option is enabled when you are working with ND2 files. Press this button and select a frame / frames to which the export will apply.
 Show memorized data,
  Memorize,
  Clear memory
 You can save the current graph to memory and display it later for comparison with another graph. Please see Graph Memorizing.
 Vertical,
  Horizontal, Angle,
  Free Angle,
  Area of Graph,
  FWHM,
FWHM,  Clear Measurement Objects,
  Reset Data
 There is a set of functions for measurement inside the graph. Please see Measurement on Graph.
 Show Measurements
 Use this button to show a table containing results of measurements made in the graph.
 Display profile data from all opened images
 Shows a legend for each channel of all opened images on the right side of the graph area.
If working with multiple images, the profile lines can be moved in sync using just one of the arrows.
 Shift Left,
  Shift Right
 Shifts the intensity profile graph left or right by the amount of pixels specified in the edit box.
The intensity profile graph may be zoomed in the usual way. You can click the zoom buttons placed on the control window sides (please see the Image Window chapter for the buttons description) or a mouse wheel can be used:
Point to the target area and roll the mouse wheel. The graph will be zoomed in/out according to mouse wheel movement direction.
Zoom while holding the Ctrl key down.
Zoom while holding the Shift key down.
Intensity profile from selected ROIs
When working with ROIs, their intensity profile can be evoked by selecting Create Profile Line from Selected ROIs in the context menu over selected ROIs.
Note
Minimal, maximal, mean and standard deviation Intensity values of all components present in the image are displayed in the status bar at the bottom of the window.
Enables advanced interactive intensity measurement. This command will create an image surface view based on evaluating the pixel intensity values. The surface can be freely rotated and zoomed.
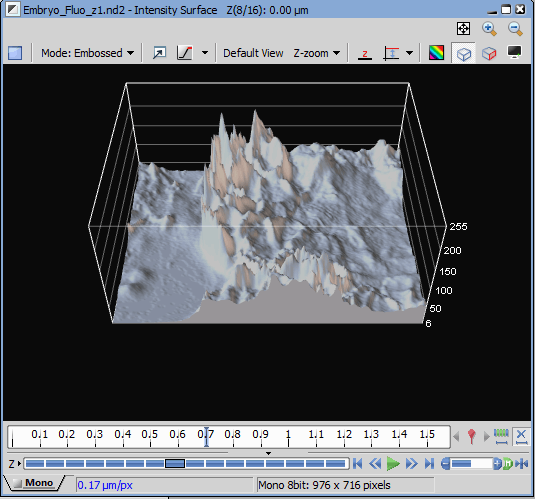
Figure 1905.
The following buttons are available:
Allows to choose the mode.
Returns image to default position in the 3D view.
Sets the zoom.
 Select Background Color
 Opens a dialog for color selection.
 Low Intensity is lowest
 Changes the mode (points with low intensity will model the surface valleys).
 Low Intensity is highest
 Reverses the surface (points with low intensity will model the surface peaks).
Vertical Manual Scale Switches on the manual scale.
 Show Box
 Displays box with intensity value scale.
 Show Crop Plane
 Displays crop plane.
 Show Legend
 Displays color scale for intensity values when the Intensities rendering mode is selected.
Switches the window to full screen.
The colors from original image are used for the view.
Only the intensities are used from the original image. Define the colors in the Gradient picker.
Enhance the surface view based on original image colors.
The intensity range is automatically scaled unless you press this button. For setting the manual scale range select the Vertical Manual Scale > Set Min/Max command.
Enter new values in a window that appears. You can use the Auto or Max buttons which help you to set the limits effectively.
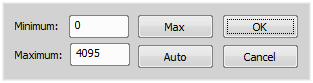
Figure 1906.
Warning
This command can be run with Live image as well as a static image. However, the computer should not get locked. The Live rendering does not work after re-login.

(requires: EDF Module)
Measures within the Z-profile graph. Please see the description of the View > Analysis Controls > EDF Z-Profile .
This command is enabled only for ND2 files with a T dimension. It tracks how a feature has changed in time.
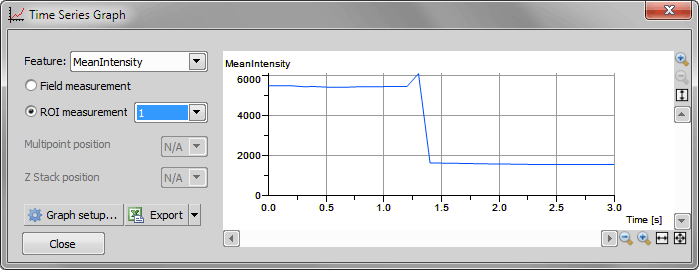
Figure 1907.
Select which feature will be used for Y axe in the graph. Possible values are the features defined by Measure->Field and ROI Features.
Select which values will be used. You can choose the measurement field data or ROI measurement data. You can further specify the ROI data by selecting one ROI from the list of all ROI and “All” in the list of possible values.
Define which XY-point will be used. You can also select All multipoint positions.
Define which Z-stack will be used.
Opens Time Measurement Options dialog.
Export the graph data to MS Excel application.
Closes the window.
Time Measurement Options dialog window
The window contains three tabs:
General Options tab
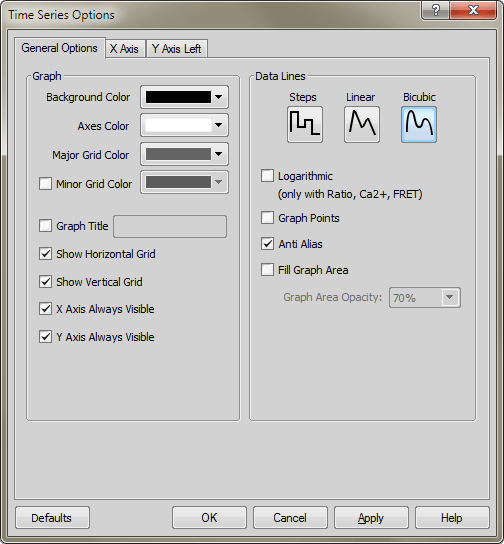
Figure 1908.
Choose background, axes and grid colors from the palette. Then check the Show ... Grid items if you want to make them visible in the graph. Check the relevant .. Axis Always Visible item to make the axis always visible while zooming in the graph.
Select interpolation method for data treatment by pressing the relevant button. You can choose Steps, Linear, or Bicubic interpolation method.
Check to use logarithmic scale in the graph.
Check this item to display data points. Small dots indicating the actual data values position can be displayed on the graph line. The points appear only if the distance between them is big enough for them to be recognized (so they usually appear when you zoom in the graph).
Turning this option on will make the graph line edges look smooth.
Check this item to fill in the area under the line chart with a color. Select the amount of opacity used from the list of predefined values.
X axis
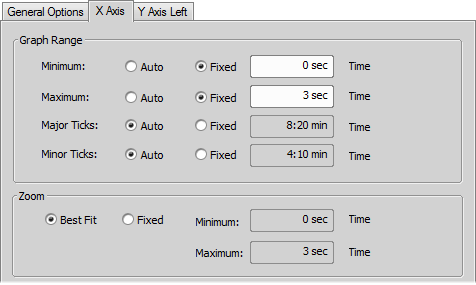
Figure 1909.
The Auto option enables that the range values are set automatically. On the contrary the range values can be set on Fixed values also. The range values can be set for minimum of X axis, maximum of X axis, major and minor grid of X axis.
If you select the Best Fit option, zoom of the X axis will be set to best fit. Otherwise you can set the Fixed range.
Y axis left
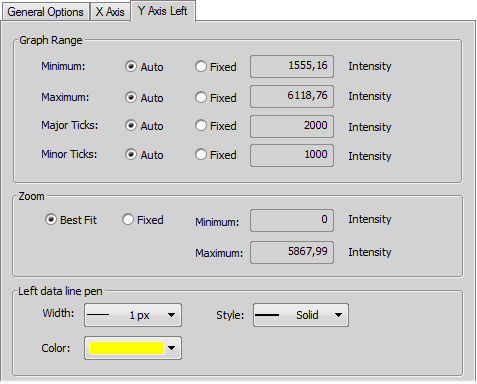
Figure 1910.
The Graph Range and Zoom options are described above.
Set the line appearance - line color (in case color of image component is not set), thickness and style (solid, dot, dashed, dash-dot).
Opens the Distance Measurement panel. Please see View > Analysis Controls > Distance Measurement .
The following window appears:
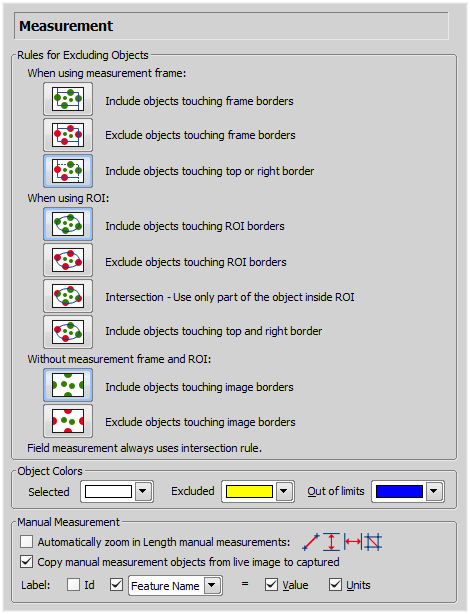
Figure 1911.
This section regards automatic measurement. Select the options how to treat the objects touching the area borders when you are performing the automatic measurement:
Pick up the option how to treat the object touching the measurement frame. Run the automatic measurement by the Measure > Use Measurement Frame command.
Pick up the option how to treat the object touching the ROI frame. Run the automatic measurement by the View > Layers > ROI command.
Pick up the option how to treat the object touching the image border. Turn off the measurement frame and ROI and run the automatic measurement.
Note
Rules for excluding objects are valid for all features of objects measurements. For field, frame and ROI measurement, these rules are taken into account only for the number of objects and do not affect the field measurement results. Field measurement is always applied inside the defined area without exceptions.
After the automatic measurement is performed, all measured objects are highlighted by color borders. Here you can select colors for the objects excluded from measurement according to the ROI/measurement frame settings. The Out of limits color will be used to highlight objects which do not fit the applied restrictions (View > Analysis Controls > Automated Measurement  ).
).
This option zooms the image while placing the measurement points to the image. Only the indicated measurement tools are affected.
If enabled, measurement objects made in the live image are copied into the captured image after the Acquire > Capture command is executed.
The manual measurement objects can be labeled. Select what information will be attached to every manual measurement object in an image.
Restores the default setting for the Measurement tab.
Confirms all changes and closes the window.
Discards all changes and closes the window.
Saves all changes and the window remains open.
Displays this help page.
Opens a dialog with taxonomy settings.
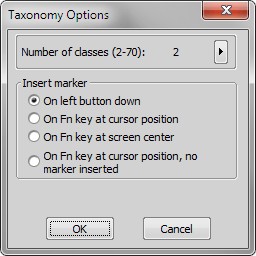
Figure 1912.
In the window select how many classes will be present and select the method of marker inserting as well.
See also Measurement Tools.
Displays/hides the measurement frame. When ON, binary objects outside the frame are omitted when performing automatic measurement. Actual settings of the frame behaviour can be set by the Measure > Options command. The frame size and position can be adjusted by mouse, or specified precisely within the Measure > Measurement Frame command window.
This command displays the measurement frame and a window for setting up the measurement frame properties. It can be also displayed from the context menu on the Turn Frame on/off button on the right image toolbar.
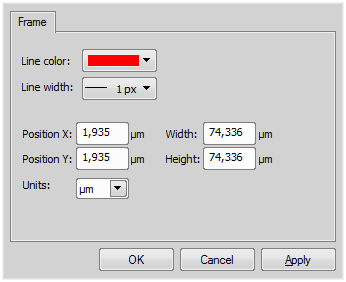
Figure 1913.
Sets the frame line color.
Sets the frame line thickness.
Sets the frame left corner coordinates.
Sets the frame dimensions.
You can select the units of the measurement frame. Pixels and the calibration units are available in case of a calibrated image.