
Main changes in GA3 are described below:
GA3 Editor window
NIS-Elements inspection functions are always available (LUTs, Binary Layers, Histogram, Image info, Profile line, 3D Object Meas, etc.).
Document can be modified without closing the editor. Preview will be switched OFF automatically. When switched back ON the preview will be recalculated.
Several crops of a big document can be made and switched between from within the editor.
The node and its output require a smaller amount of space.
The new node visualization provides a clear and distinct visual separation between various output types (Color, Binary, Table, Graph, etc.) and 2D/3D nodes.
A more meaningful category list.
Switch between 2D and 3D nodes to prevent accidental mixing.
All nodes on the screen at once (collapsible).
Efficient search with the capability to insert nodes, eliminating the need to view the node list.
Figure 671.
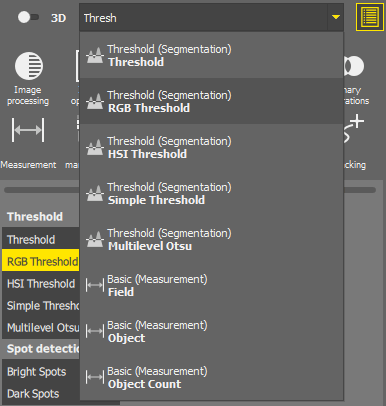
Figure 672.
Visually group nodes (color and name).
Independent zoom. The section can be minimized to create extra space for editing other parts of the GA3 and maximized when needed.
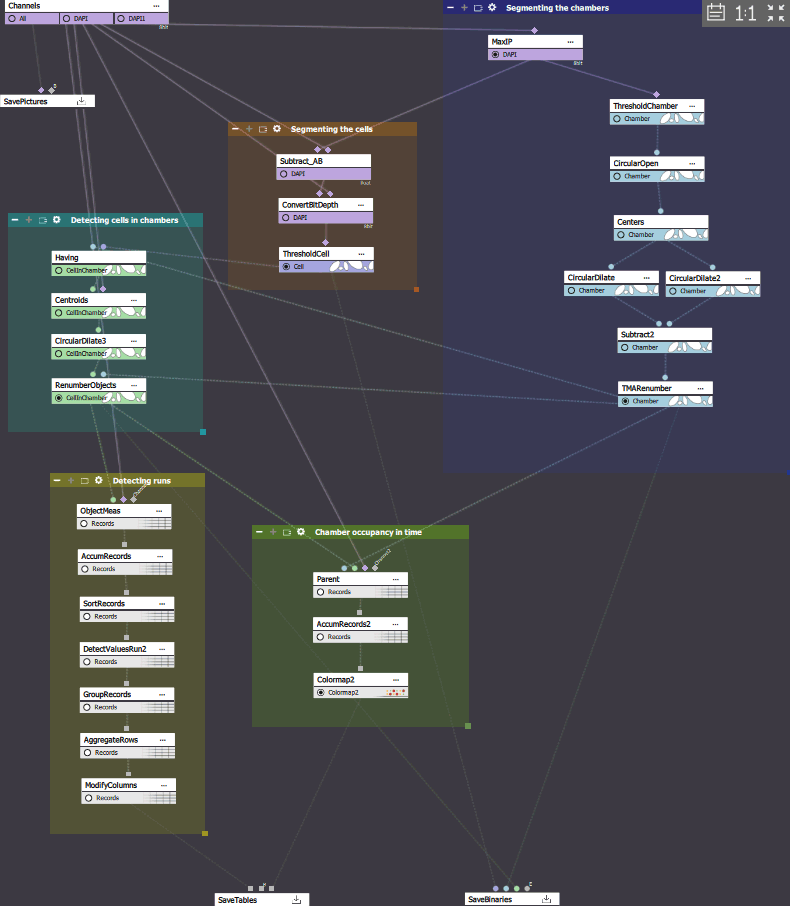
Figure 673.
Nodes
New save nodes (color image, binary, tables) which cannot be deleted.
What needs to be saved should be connected to these nodes. Save preferences can be set by clicking and choosing to save into an ND2 file or to Keep input file format (for channels) or to Save into associated HDF5 file (for binaries).
When a recipe is run it creates or modifies files (ND2, H5) files based on what the recipe does. Specifically what is connected t these save nodes.
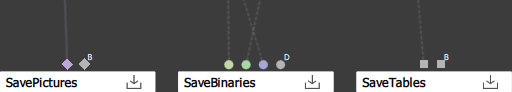
Figure 674.
Do not confuse what is shown in the preview with what is actually saved when running the recipe.
When a recipe (e.g. Decon.ga3) modifies image channels (a.k.a. color data) on an existing image (e.g. image.nd2) a new ND2 file is created. In this case it will be named image - Decon.nd2.
Any other output (binary, tables, results, …) of a recipe is stored inside an HDF5 file alongside the original ND2 with the same file base name as the ND2. The H5 file can contain more than one analysis result.
When running a CellCount.ga3 recipe that saves only binaries and tables and does not modify the image channels on the image.nd2 file it will produce a new H5 file image.h5.
When image channels are modified and other outputs are saved by the recipe a new ND2 file and a new H5 file is generated. In this case it will result in image - DenoisedRatio.nd2 and image - DenoisedRatio.h5.
This logic preserves the original ND2 files.
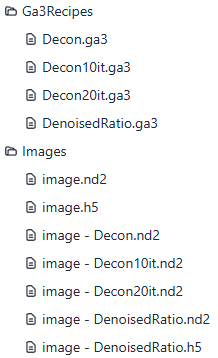
Figure 675.
The individual measurement features are grouped into nodes, including field, object, object count, parent, and cell.
Renaming, ordering, visibility, joining, calculation is available inside the node.
New Measurement > Basic > Cell node to simplify cell measurements (must be connected to Binary processing > Cell Processing > Make Cell).
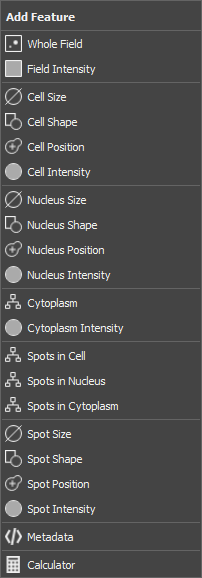
Figure 676.
New results nodes (graphs, table and well-plate views) enhance the after-run interactivity.
New graphs currently support feature selection and range.
Legacy graphs continue to be supported under the Legacy Graphs category.
New table allows for efficient filtering.
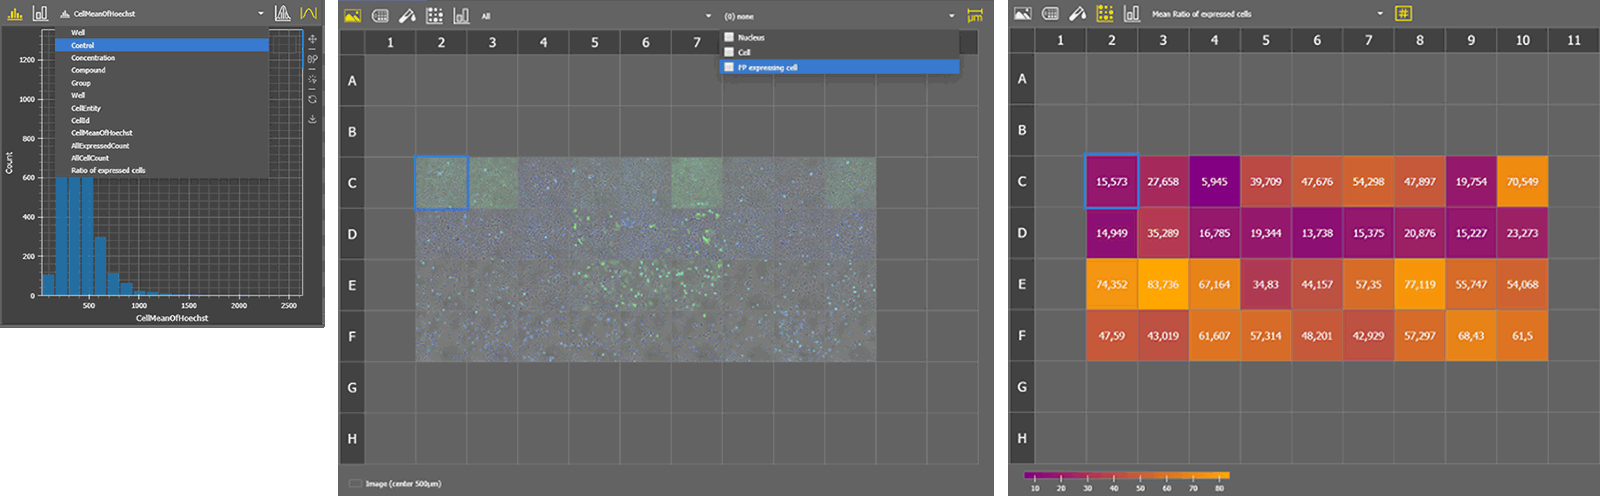
Figure 677.
The introduction of horizontal (Results & Graphs > Layout > Horizontal), stacked (Results & Graphs > Layout > Stacked), and display (Results & Graphs > Layout > Display) layout nodes enables the creation of application-like results displays.
The  View > Analysis Controls > GA3 Results - Main
  and View > Analysis Controls > GA3 Results - Side menu functions activate the menu and side panel which is filled with results specified in the Results & Graphs > Layout > Display node.