
GA3 Python nodes (ND Processing & Conversions > Python Scripting > Python) support a wide range of Python packages, enabling advanced data analysis, visualization, and computational capabilities. By integrating scientific libraries directly into GA3 recipes, the platform’s functionality can be extended to meet specific research needs. Whether performing statistical analysis, processing images, analyzing large datasets, or applying machine learning techniques, Python nodes offer the flexibility to enhance workflows with customized scripts.
This section provides examples of how various scientific Python packages can be used within GA3, helping to streamline research and maximize the available tools.
For more GA3 examples, check the Laboratory Imaging GitHub repository GA3-examples.
NIS-Elements come with many scientific packages preinstalled. In order to install additional python modules use separate environments or managed environment in the Python node (see below).
This workflows showcases a simple working example of using NumPy library for segmentation (see numpy.org).
Setup
Open the file that needs to be segmented.
In the GA3 Editor:
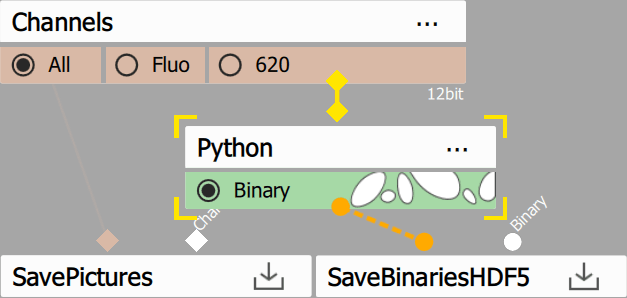
Figure 773.
Code
GA3 Python Editor
# IMPORTANT: 'limnode' must be imported like this (not from nor as)
import limnode
import numpy as np

# defines output parameter properties
def output(inp: limnode.InDefTuple, out: limnode.OutDefTuple, par: limnode.UserParTuple) -> None:
    out[0].makeNew("Binary", "#00ff00")

# return Program for dimension reduction or two-pass processing
def build(par: limnode.UserParTuple, loops: limnode.LoopDefs) -> limnode.Program|None:
    return None

# called for each frame/volume
def run(inp: limnode.InDataTuple, out: limnode.OutDataTuple, par: limnode.UserParTuple, ctx: limnode.RunContext) -> None:
    img = inp[0].data
    bin = np.where((img >= 300) & (img <= 400), 1, 0)
    out[0].data[:] = bin.astype(np.uint8)

# child process initialization (when outproc is set)
if __name__ == '__main__':
    from limnode import print
    limnode.child_main(run, output, build)
The code:
Imports NumPy. [line 3]
Names binary output as “Binary” and sets its color green. [line 7]
Get color data. [line 15]
Segments values in range from 300 to 400 (edit as needed) [line 16]
Stores data to output as unsigned 8bit integer. [line 17]
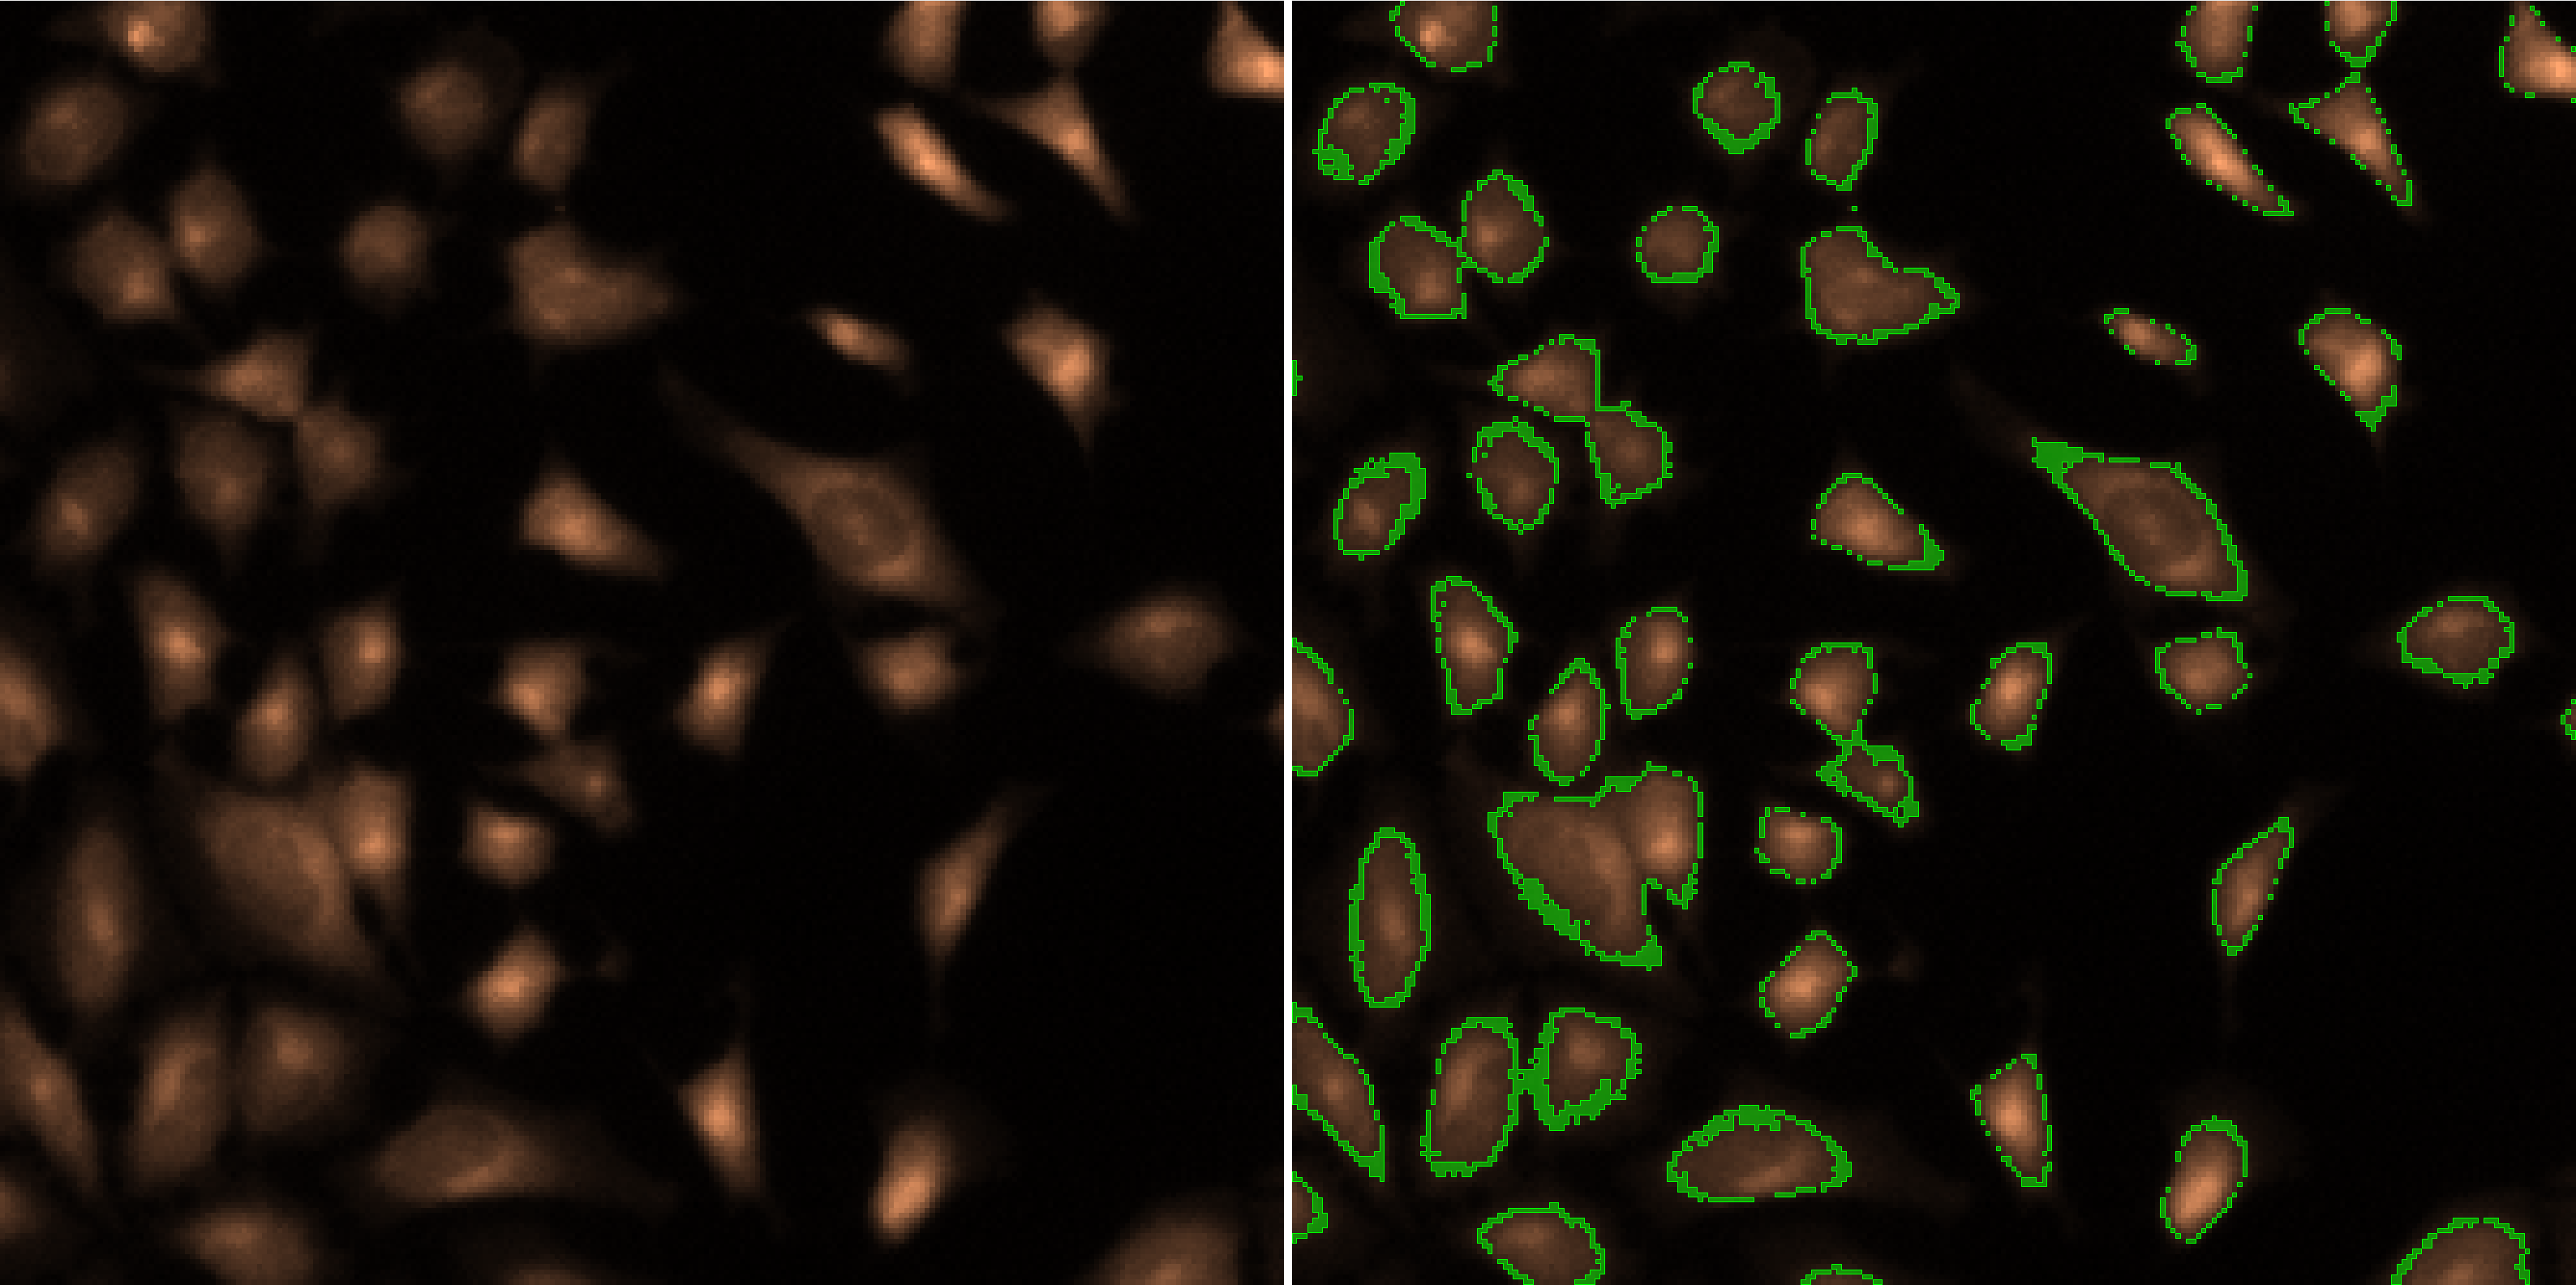
Figure 774. Results.
Scikit-image is “a collection of algorithms for image processing” (see scikit-image.org).
Setup
Open the file that needs to be segmented.
In the GA3 Editor:
Add Python node and open its settings .
 Add color input.
 Add binary output.
Insert code from Code section.
Connect the input pin to the Channels output to be segmented.
Connect the output pin to the SaveBinariesHDF5 node.
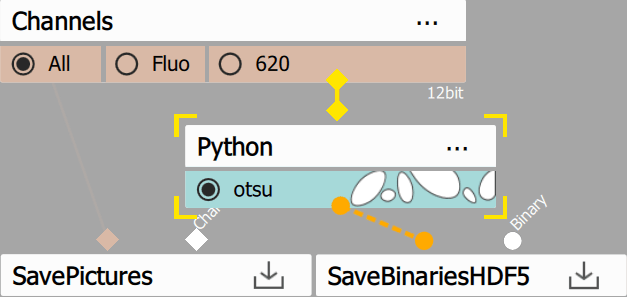
Figure 775.
Code
# IMPORTANT: 'limnode' must be imported like this (not from nor as)
import limnode, numpy
from skimage import filters

# defines output parameter properties
def output(inp: limnode.InDefTuple, out: limnode.OutDefTuple, par: limnode.UserParTuple) -> None:
    out[0].makeNew("otsu", (0, 255, 255))

# return Program for dimension reduction or two-pass processing
def build(par: limnode.UserParTuple, loops: limnode.LoopDefs) -> limnode.Program|None:
    return None

# called for each frame/volume
def run(inp: limnode.InDataTuple, out: limnode.OutDataTuple, par: limnode.UserParTuple, ctx: limnode.RunContext) -> None:
    image = inp[0].data[0, :, :, 0]
    threshold = filters.threshold_otsu(image)
    binary = image > threshold
    out[0].data[0, :, :, 0] = binary.astype(numpy.uint8)

# child process initialization (when outproc is set)
if __name__ == '__main__':
    from limnode import print
    limnode.child_main(run, output, build)
Imports NumPy and filters from the scikit-image package [lines 2, 3].
Defines the output to be a new binary named “otsu” and sets cyan color. [line 7].
Takes the image from the inp array [line 15].
Calculates the threshold calling threshold_otsu [line 16].
Creates the binary by directly comparing the values from the image with the threshold value [line 17].
Sets the binary data into the out array while converting to the proper format (uint8 or int32 for binary IDs) [line 18].
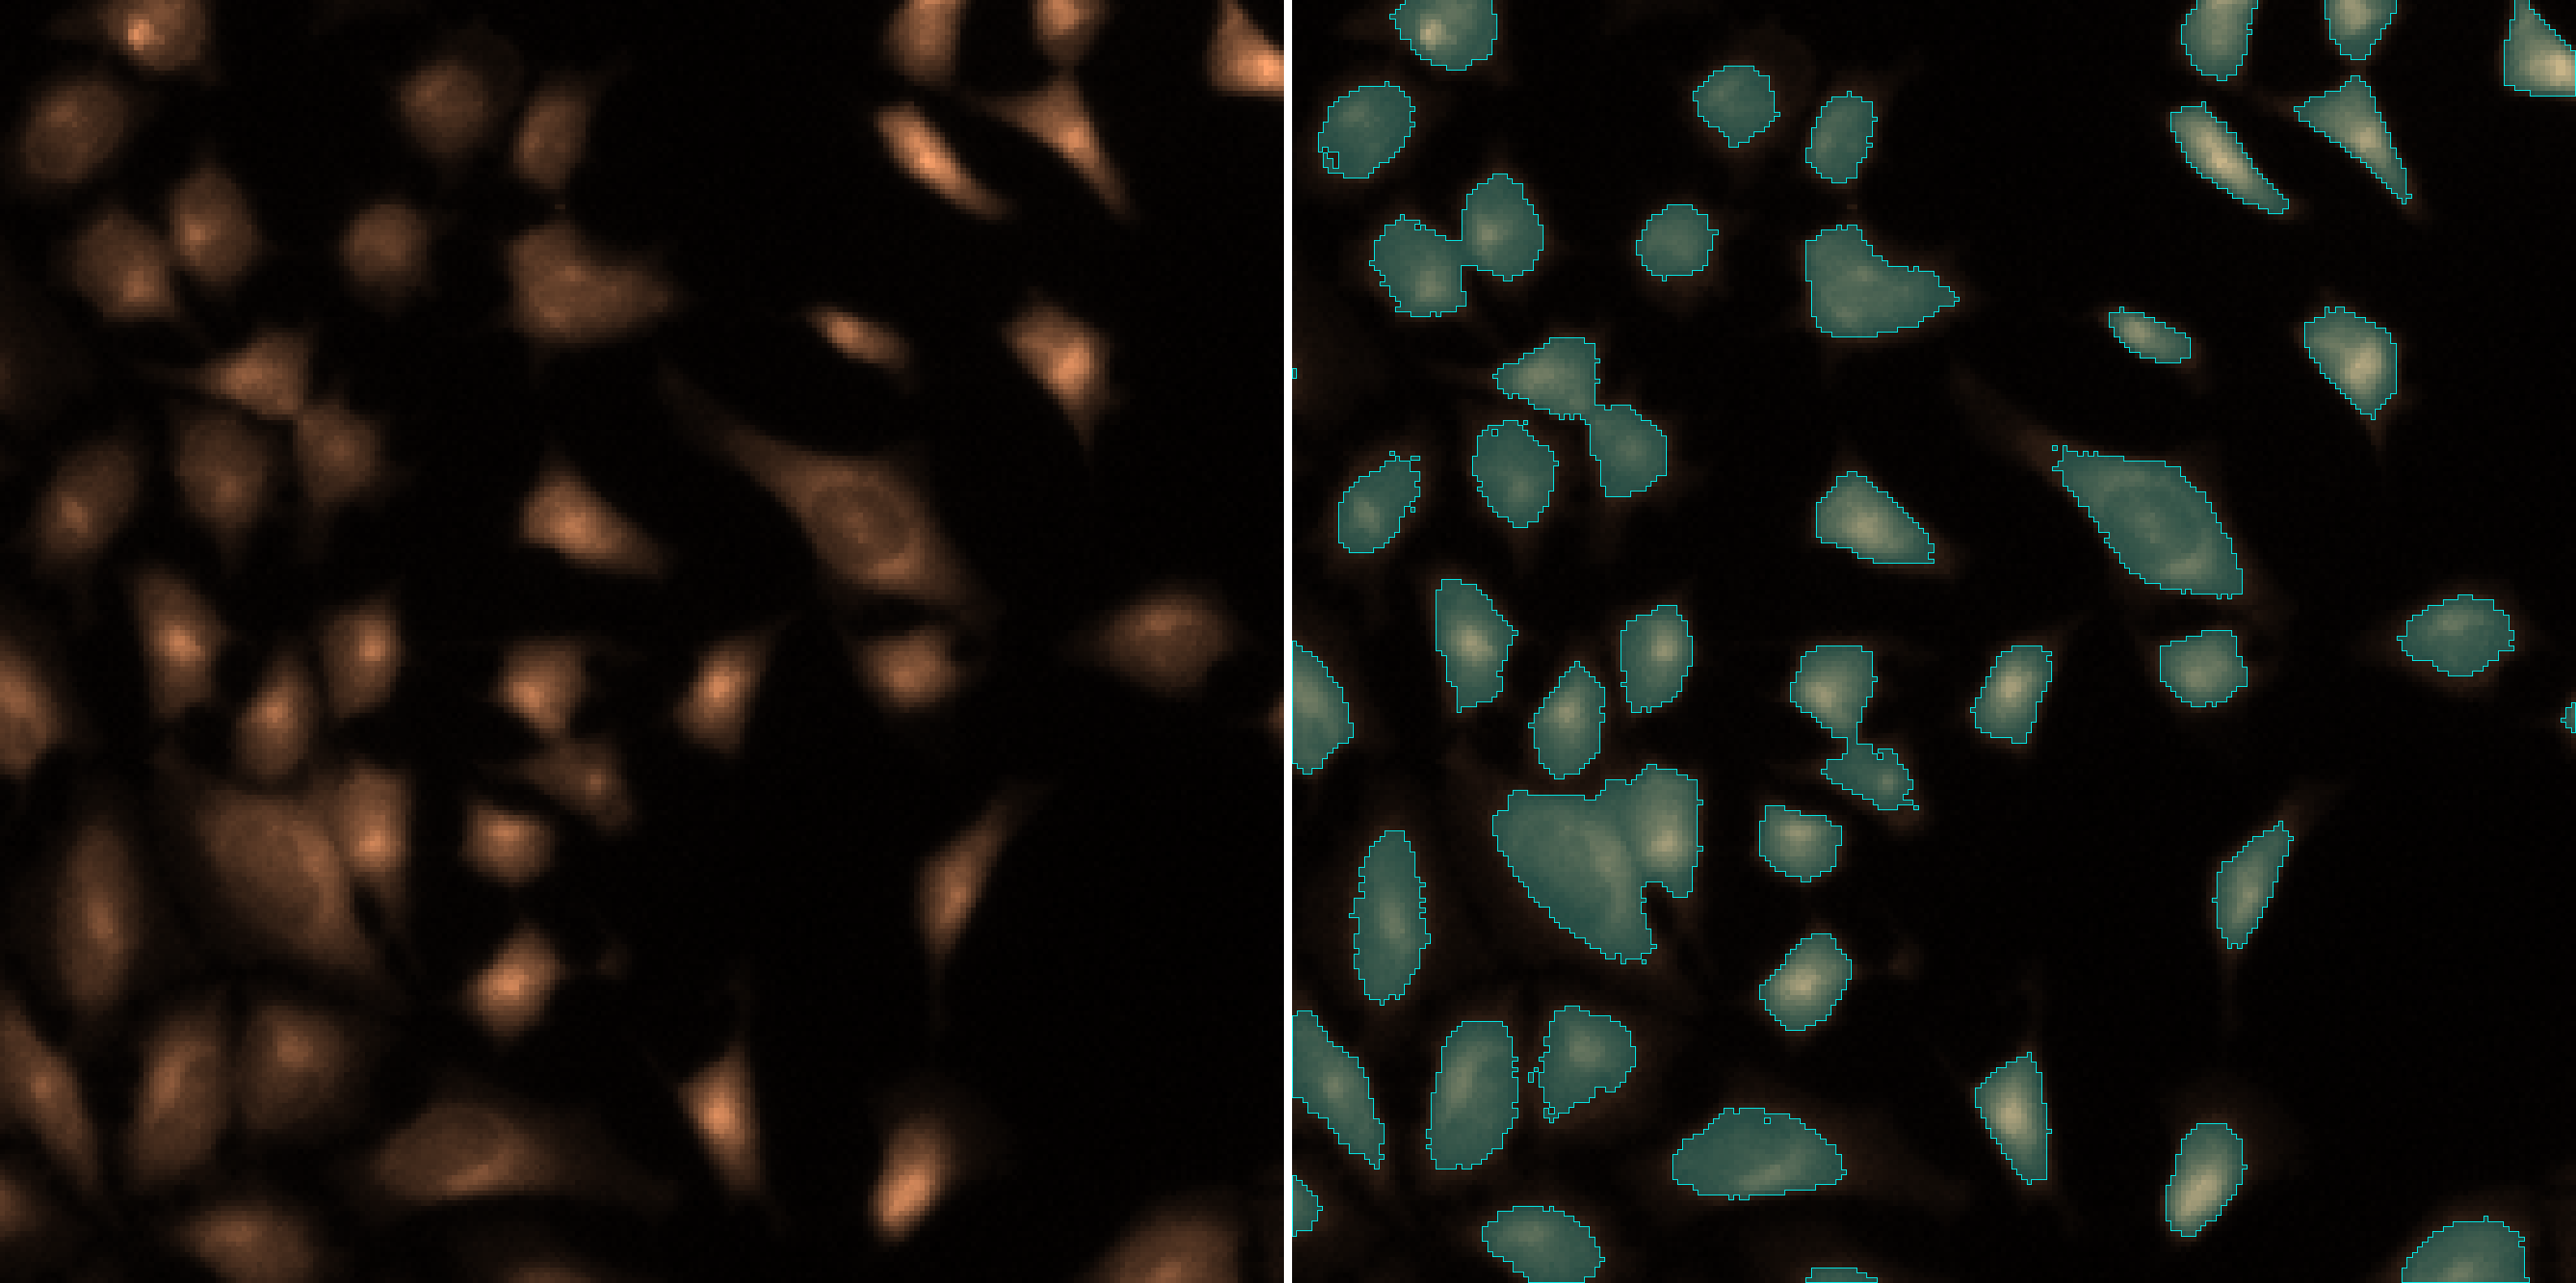
Figure 776. Results.
BaSiCPy is a library “for background and shading correction of optical microscopy images” (see BaSiCPy).
Setup
Open the file that needs to be processed.
In the GA3 Editor:
- Add Channel input.
 Add Channel output.
Set the python mode to “Managed environment”.
Insert the environment from the Environment section.
Insert the code from Code section.
Connect the input pin to the Channels output to be processed.
Connect the output pin to the SavePictures node.
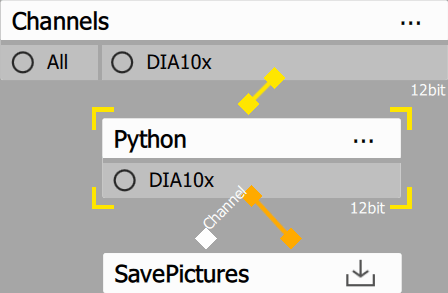
Figure 777.
Environment
channels:
    - conda-forge
dependencies:
    - python=3.10
    - pip
    - pip:
        - "scipy<1.13"
        - "jax[cpu]==0.4.13"
        - "hyperactive<5"
        - "ml-dtypes==0.2.0"
        - basicpy
variables:
  PIP_FIND_LINKS: "https://whls.blob.core.windows.net/unstable/index.html"
  PIP_USE_DEPRECATED: "legacy-resolver"
The environment was created and tested in the November, 2025.
Tip
Consult with LLMs (e.g. ChatGPT) in case the versions do not work anymore.
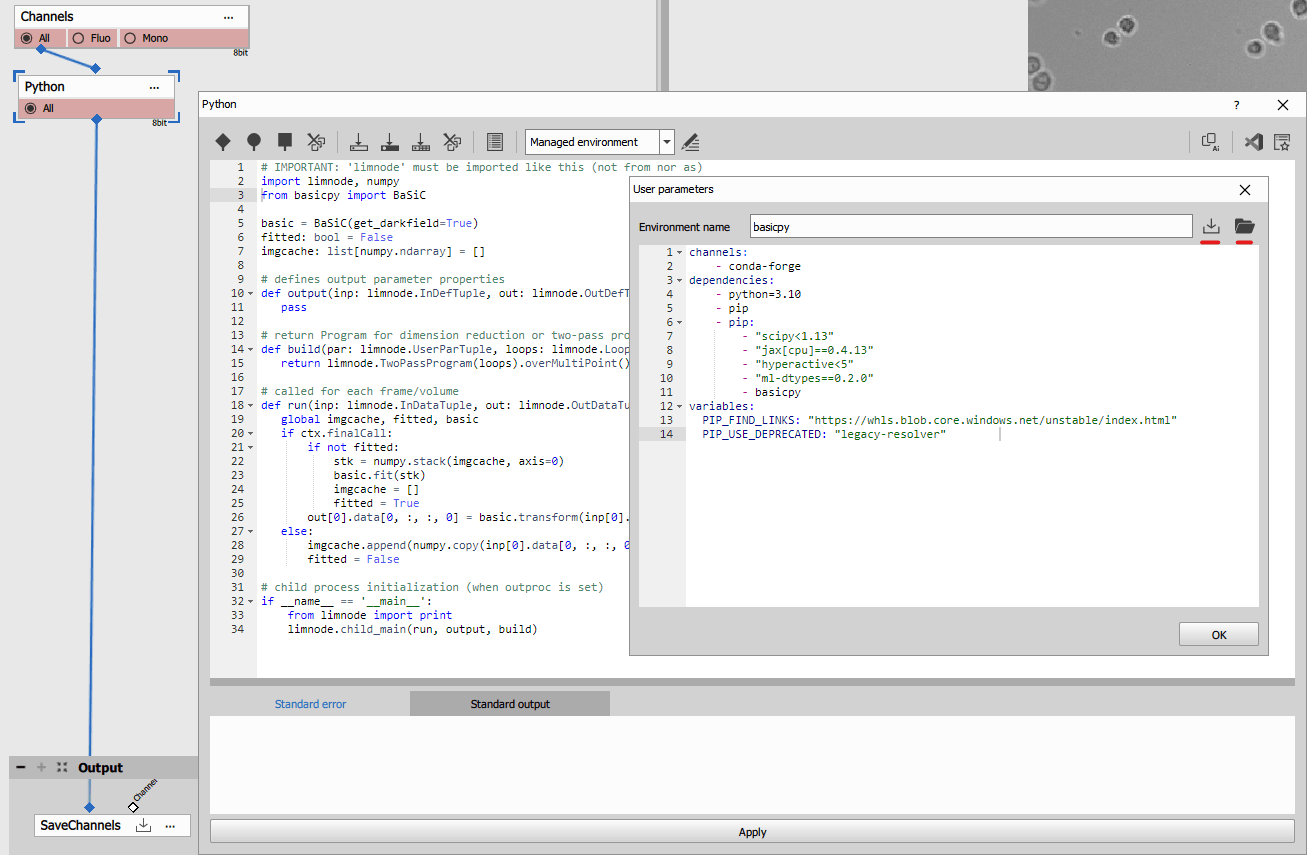
Figure 778.
Code
# IMPORTANT: 'limnode' must be imported like this (not from nor as)
import limnode, numpy
from basicpy import BaSiC

basic = BaSiC(get_darkfield=True)
fitted: bool = False
imgcache: list[numpy.ndarray] = []

# defines output parameter properties
def output(inp: limnode.InDefTuple, out: limnode.OutDefTuple, par: limnode.UserParTuple) -> None:
   pass

# return Program for dimension reduction or two-pass processing
def build(par: limnode.UserParTuple, loops: limnode.LoopDefs) -> limnode.Program|None:
   return limnode.TwoPassProgram(loops).overMultiPoint()

# called for each frame/volume
def run(inp: limnode.InDataTuple, out: limnode.OutDataTuple, par: limnode.UserParTuple, ctx: limnode.RunContext) -> None:
   global imgcache, fitted, basic
   if ctx.finalCall:
       if not fitted:
           stk = numpy.stack(imgcache, axis=0)
           basic.fit(stk)
           imgcache = []
           fitted = True
       out[0].data[0, :, :, 0] = basic.transform(inp[0].data[0, :, :, 0])[0]
   else:
       imgcache.append(numpy.copy(inp[0].data[0, :, :, 0]))
       fitted = False

# child process initialization (when outproc is set)
if __name__ == '__main__':
    from limnode import print
    limnode.child_main(run, output, build)
Imports NumPy and basicpy from the BaSiC package [lines 2, 3].
Initializes global variables for two pass processing [lines 5-7].
Sets up two pass progam [line 15].
Enables using global variables in run [line 19].
Calculates shading correction (only once) and applies to every frame in second pass[lines 21-26].
Collects data in first pass [lines 27-29].
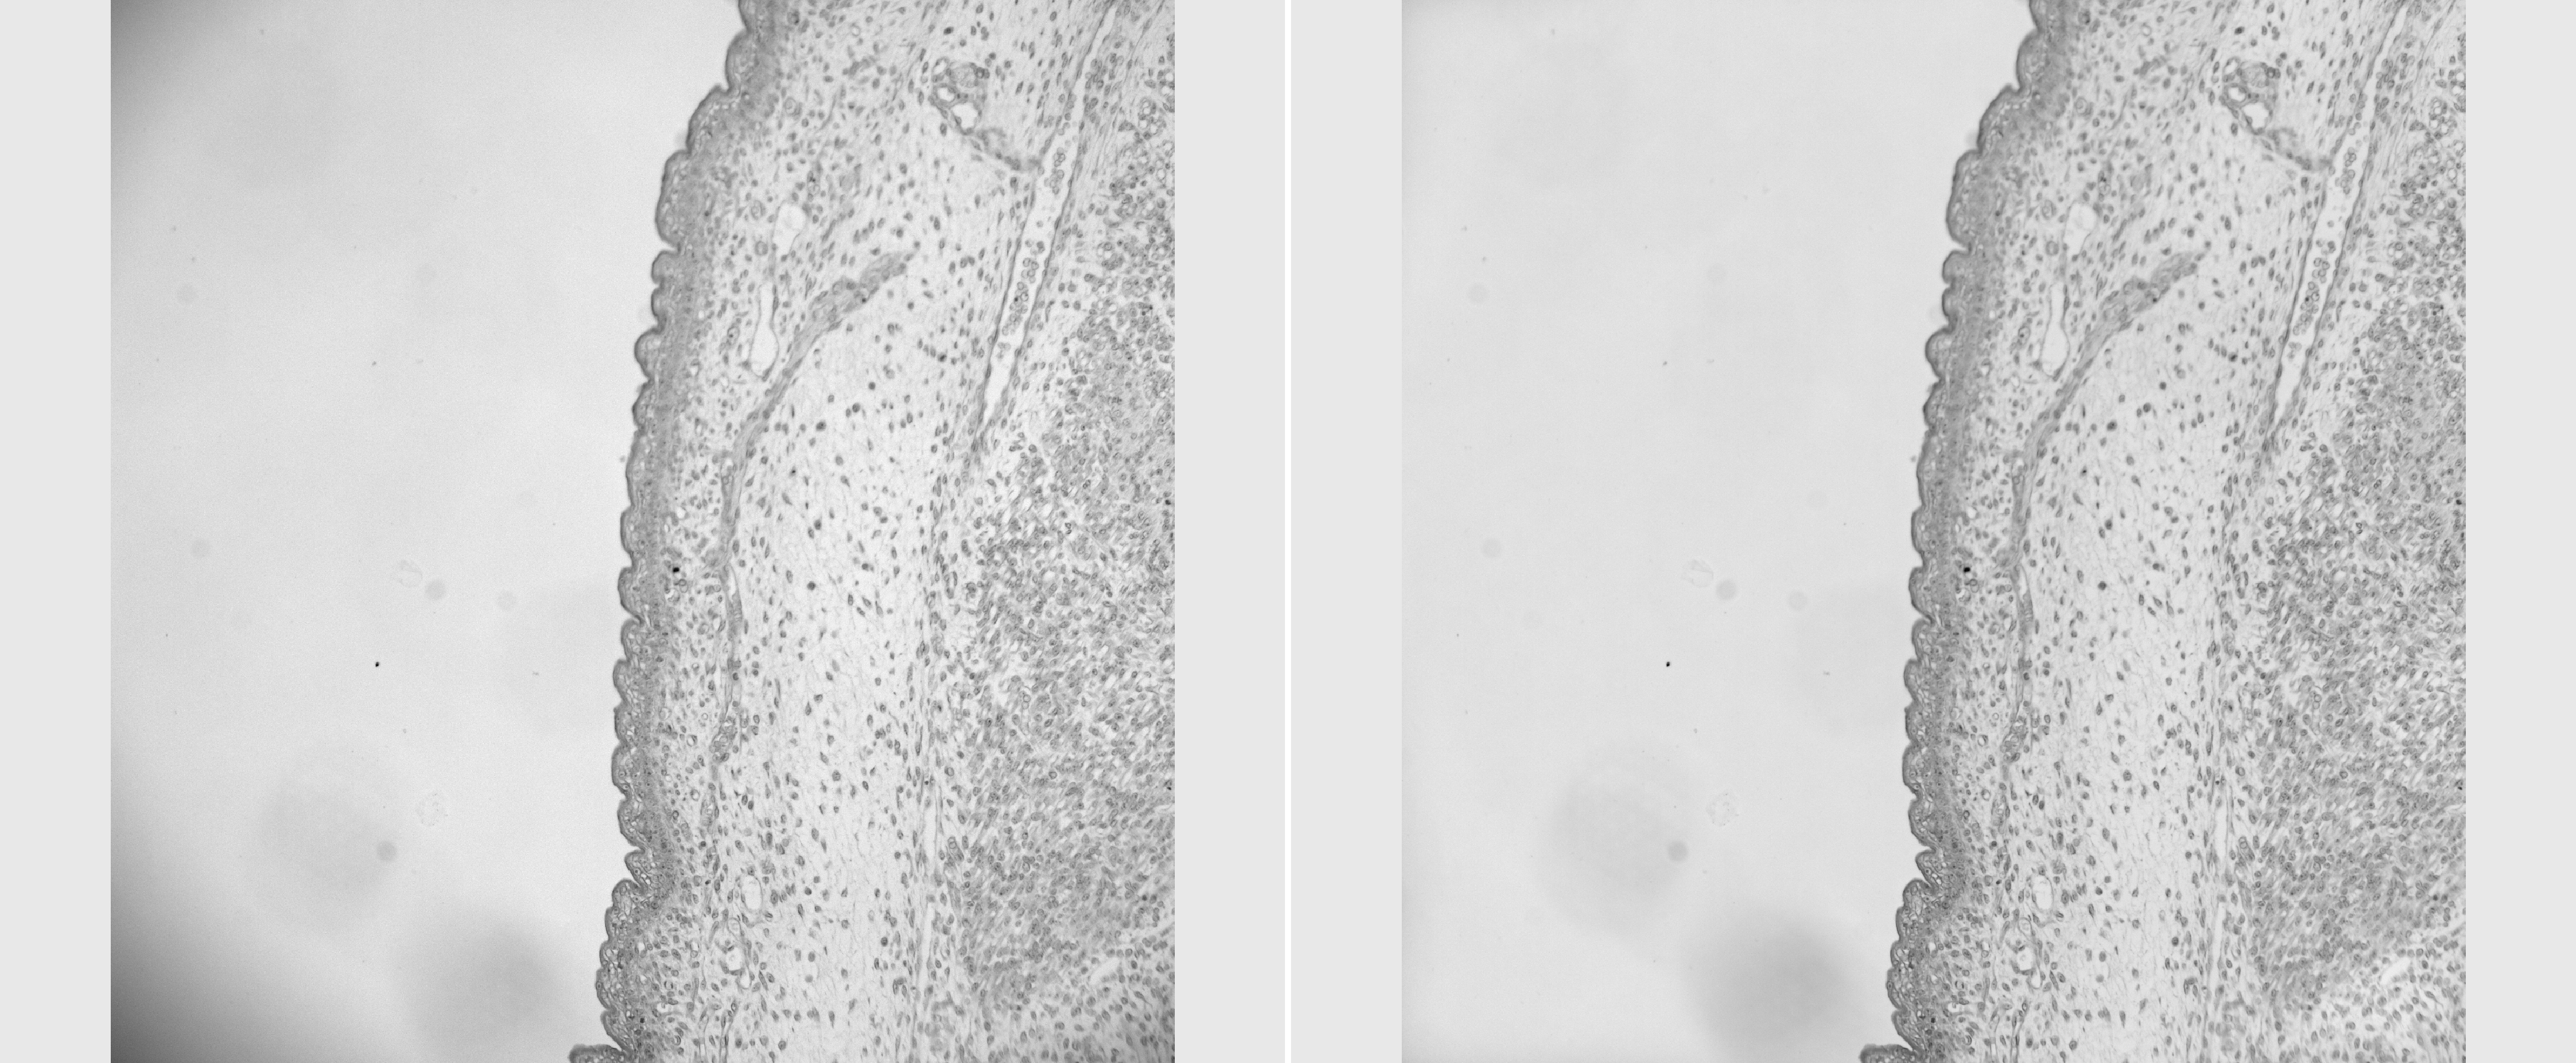
Figure 779. Results.
Open the
02_count_in_t.nd2 time-lase nd2 image and
02_object_count_fluo.ga3 recipe.
Replace both graph nodes with a Python node. Both having Table as single input and single output.
Note
Paste the code before connecting the output.
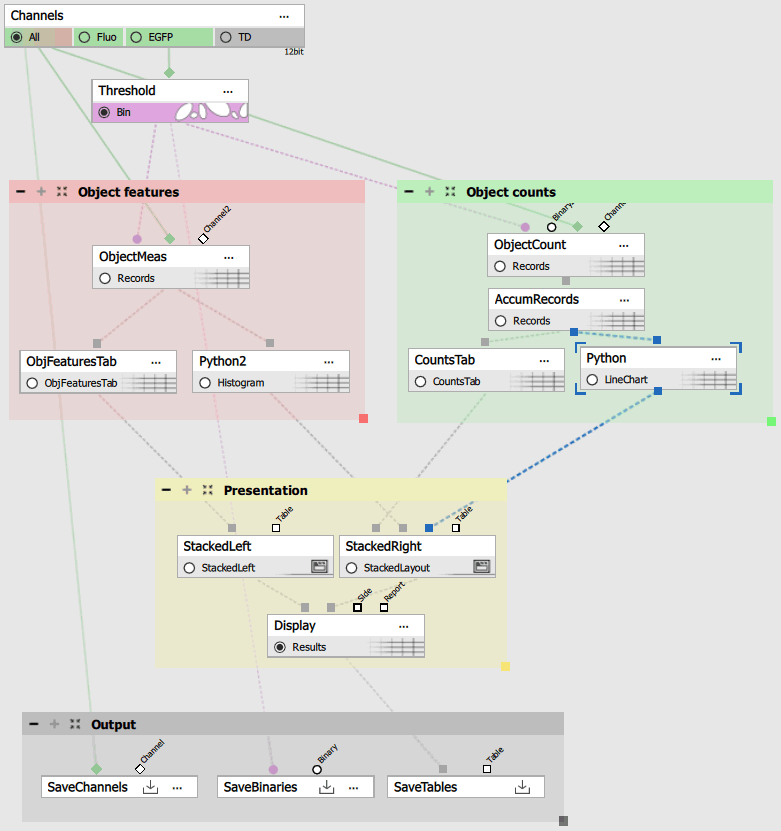
Figure 780. Python nodes replacing the standard GA3 graphs.
Object count vs. time
In the output() function [line 37] make the table result and provide it with input parameter (for taking the accumulation from the inp[0]),
define the draw_graph() function [line 19] that actually draws the graph giving it the x, y data and background and foreground colors,
call the draw_graph function twice for generating light and dark graphs [lines 48, 49] and finally
call the withMplImage() method [line 52] to render the matplotlib figure into an image.
The withMplImage() takes following arguments:
a tuple with ND loop indexes of the current frame or accumulated loop (ctx.inpParameterCoordinates[i] where i is the index of the input parameter is a good starting point) and
a single figure or pyplot object or tuple of two such objects for light and dark color scheme.
Note
Use the figure object as in the example below instead of matplotlib.pyplot global instance which may be in unexpected state when the node run function is called.
# IMPORTANT: 'limnode' must be imported like this (not from nor as)
import limnode

import numpy as np
from matplotlib.backends.backend_agg import FigureCanvasAgg as FigureCanvas
from matplotlib.figure import Figure
from matplotlib.ticker import FuncFormatter
import datetime, io, json

savefig_kwargs: dict = {
    'format': 'png',
    'bbox_inches': 'tight',
    'pad_inches': 0.25
}

def seconds_to_hms(x, _):
    return str(datetime.timedelta(seconds=int(x)))

def draw_graph(x, y, bgcolor, fgcolor):
    fig = Figure(figsize=(12, 4), facecolor=bgcolor)
    ax = fig.add_subplot(1, 1, 1, facecolor=bgcolor)
    ax.plot(x, y, marker='o', color='#77aadd', linewidth=2)
    ax.set_title("Object Count vs Time", fontsize=14, color=fgcolor)
    ax.set_xlabel("Time (hh:mm:ss)", fontsize=12, color=fgcolor)
    ax.set_ylabel("Count", fontsize=12, color=fgcolor)
    ax.grid(True, alpha=0.6, color='gray')
    ax.tick_params(axis='both', colors=fgcolor)
    for label in ax.get_xticklabels() + ax.get_yticklabels():
        label.set_color(fgcolor)
    for spine in ax.spines.values():
        spine.set_color(fgcolor)
    ax.xaxis.set_major_formatter(FuncFormatter(seconds_to_hms))
    return fig

# defines output parameter properties
def output(inp: limnode.InDefTuple, out: limnode.OutDefTuple, par: limnode.UserParTuple) -> None:
    out[0].makeResult("LineChart", inp[0])

# return Program for dimension reduction or two-pass processing
def build(par: limnode.UserParTuple, loops: limnode.LoopDefs) -> limnode.Program|None:
    return None

# called for each frame/volume
def run(inp: limnode.InDataTuple, out: limnode.OutDataTuple, par: limnode.UserParTuple, ctx: limnode.RunContext) -> None:
    Time = inp[0].colArray("Time")
    ObjectCount = inp[0].colArray("ObjectCount")

    canvasLight = draw_graph(Time, ObjectCount, '#fcfcfc', '#000000')
    canvasDark = draw_graph(Time, ObjectCount, '#444444', '#f0f0f0')


    out[0].withMplImage(ctx.inpParameterCoordinates[0], (canvasLight, canvasDark), savefig_kwargs=savefig_kwargs, iconres="line_common")

# child process initialization (when outproc is set)
if __name__ == '__main__':
    from limnode import print
    limnode.child_main(run, output, build)
The above python code produces following line chart.
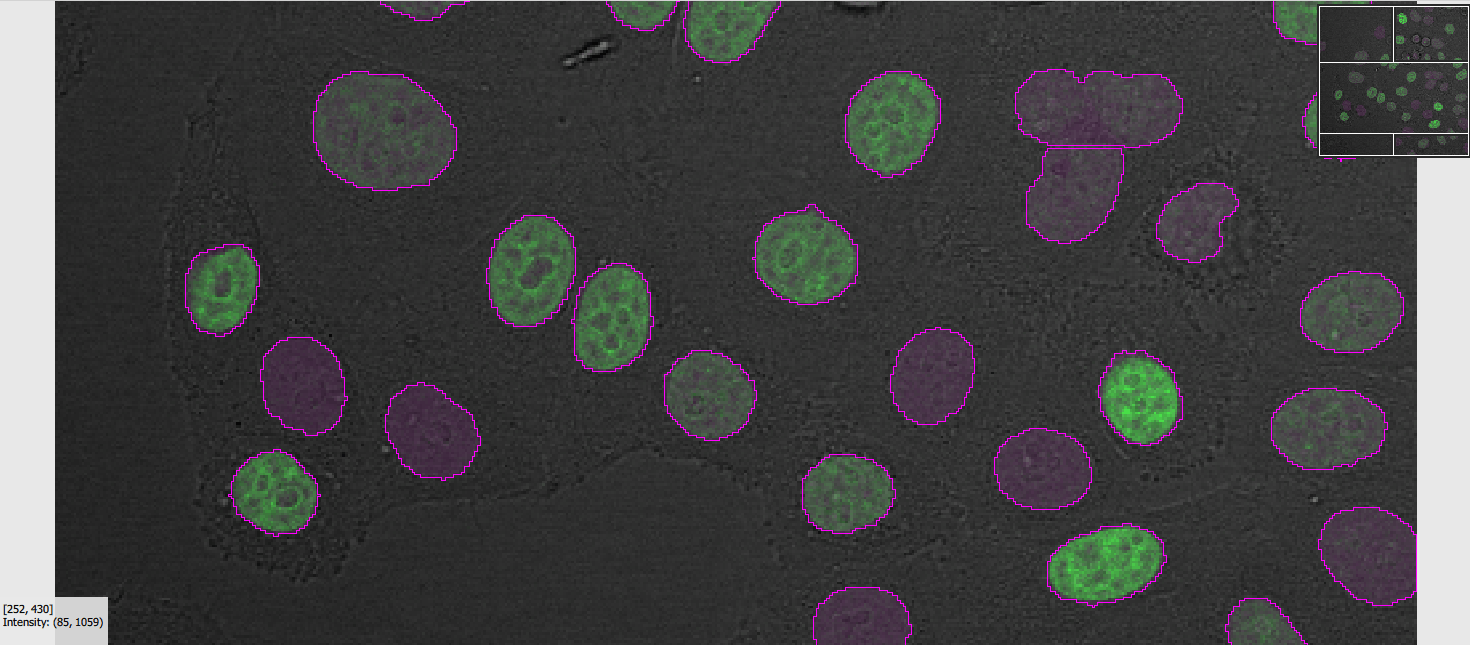
Figure 781.
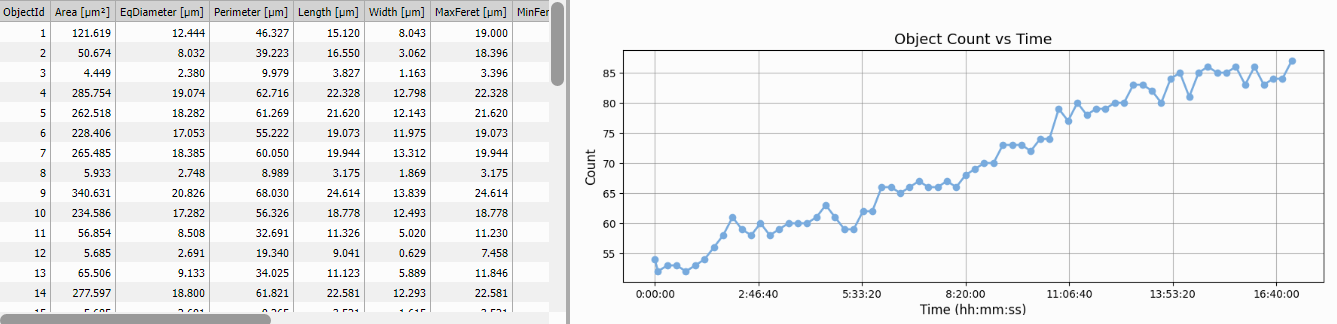
Figure 782. Line chart by matplotlib in the light scheme.
Histogram of object sizes per frame
Similarly with histogram:
GA3 Python editor
# IMPORTANT: 'limnode' must be imported like this (not from nor as)
import limnode

import numpy as np
from matplotlib.backends.backend_agg import FigureCanvasAgg as FigureCanvas
from matplotlib.figure import Figure
from matplotlib.ticker import FuncFormatter
import io, json

savefig_kwargs: dict = {
    'format': 'png',
    'bbox_inches': 'tight',
    'pad_inches': 0.25
}

def draw_graph(data, bgcolor, fgcolor):
    fig = Figure(figsize=(12, 4), facecolor=bgcolor)
    ax = fig.add_subplot(1, 1, 1, facecolor=bgcolor)
    ax.hist(data, bins=30, color='#77aadd', edgecolor='#77aadd22')
    ax.set_title("Histogram of Object Sizes", fontsize=14, color=fgcolor)
    ax.set_xlabel("Size (equivalent diameter)", fontsize=12, color=fgcolor)
    ax.set_ylabel("Frequency", fontsize=12, color=fgcolor)
    #ax.grid(True, alpha=0.6, color='gray')
    ax.tick_params(axis='y', colors=fgcolor)
    for label in ax.get_xticklabels() + ax.get_yticklabels():
        label.set_color(fgcolor)
    for spine in ax.spines.values():
        spine.set_color(fgcolor)
    return fig

# defines output parameter properties
def output(inp: limnode.InDefTuple, out: limnode.OutDefTuple, par: limnode.UserParTuple) -> None:
    out[0].makeResult("Histogram", inp[0])

# return Program for dimension reduction or two-pass processing
def build(par: limnode.UserParTuple, loops: limnode.LoopDefs) -> limnode.Program|None:
    return None

# called for each frame/volume
def run(inp: limnode.InDataTuple, out: limnode.OutDataTuple, par: limnode.UserParTuple, ctx: limnode.RunContext) -> None:
    ObjectSizes = inp[0].colArray("EqDiameter")

    canvasLight = draw_graph(ObjectSizes, '#fcfcfc', '#000000')
    canvasDark = draw_graph(ObjectSizes, '#444444', '#f0f0f0')

    out[0].withMplImage(ctx.inpParameterCoordinates[0], (canvasLight, canvasDark), savefig_kwargs=savefig_kwargs, iconres="histo_common")

# child process initialization (when outproc is set)
if __name__ == '__main__':
    from limnode import print
    limnode.child_main(run, output, build)
The above python code produces following histogram.
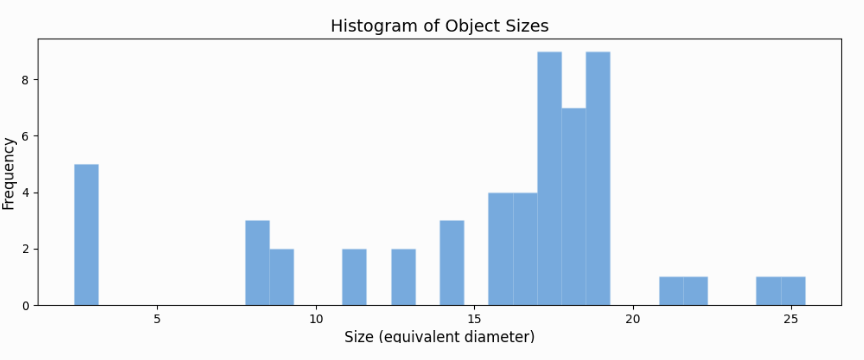
Figure 783. Histogram by matplotlib.
Conclusion
These two examples are not the fanciest plots. The lack interactivity as the native GA3 plots because they are rendered into a static image (or two: light and dark). However based on the aggregation of the inputs and loop coordinates the histogram will change as the current frame changes and linechart of counts vs. time will not as there is only one plot of aggregated counts.
Stardist is a popular AI segmentation package.
As it needs tensorflow to be installed in oreder for Stardist to run it is suggested to install it in a separate environment. Follow the tensorflow guide for Windows installation.
In the GA3 node add
- one channel input,
- one binary output and
- set the Execution mode to “Managed environment”.
Edit the environment and insert following definition:
CPU:
channels:
    - conda-forge
dependencies:
    - python=3.10           # minimum for NIS-Elements
    - pip
    - pip:
        - tensorflow
        - stardist
        - numpy==1.26
GPU:
channels:
    - conda-forge
dependencies:
    - python=3.10           # minimum for NIS-Elements
    - cudatoolkit=11.2
    - cudnn=8.1.0
    - pip
    - pip:
        - tensorflow<2.11
        - stardist
        - numpy==1.26
Then install it by clicking the “Install managed environment” icon. Be patient it takes time.
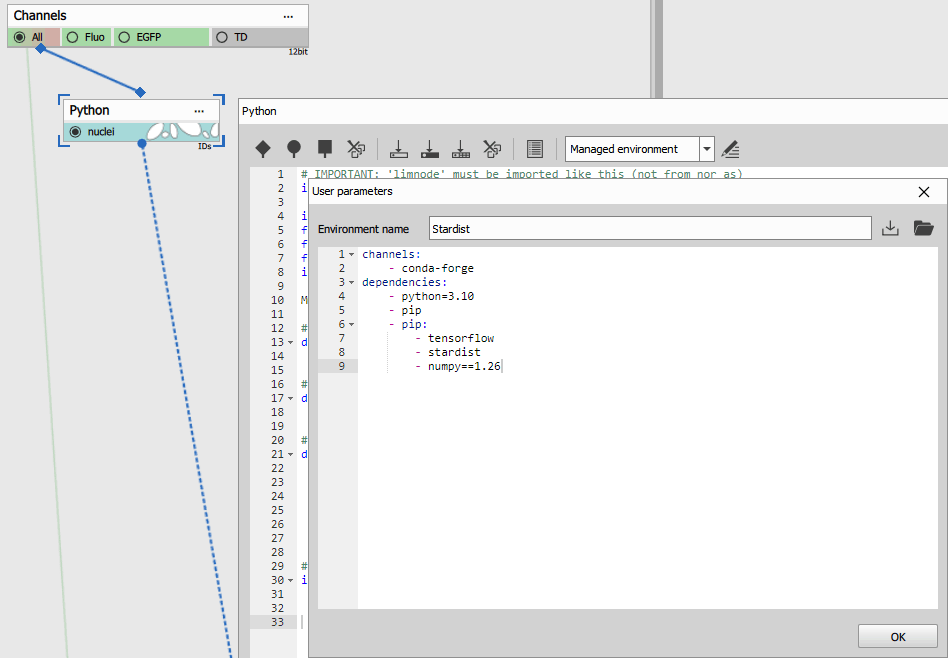
Figure 784. Stardist: Managed environment.
Note
Uncomment the two lines below “Check GPU” and output like this should appear in the Standard output tab:
[PhysicalDevice(name='/physical_device:GPU:0', device_type='GPU')]
Insert the code as follows:
# IMPORTANT: 'limnode' must be imported like this (not from nor as)
import limnode

# Lazy load on first run
model = None

# defines output parameter properties
def output(inp: limnode.InDefTuple, out: limnode.OutDefTuple, par: limnode.UserParTuple) -> None:
    out[0].makeNew("nuclei", (0, 255, 255)).makeInt32()

# return Program for dimension reduction or two-pass processing
def build(par: limnode.UserParTuple, loops: limnode.LoopDefs) -> limnode.Program|None:
    return None

# called for each frame/volume
def run(inp: limnode.InDataTuple, out: limnode.OutDataTuple, par: limnode.UserParTuple, ctx: limnode.RunContext) -> None:
    global model

    import numpy
    from csbdeep.utils import normalize
    from stardist.models import StarDist2D

    # Check GPU
    # import tensorflow as tf
    # print(tf.config.list_physical_devices('GPU'))

    if model is None:
        model = StarDist2D.from_pretrained('2D_versatile_fluo')

    img = inp[0].data[0, :, :, 0]
    labels,_= model.predict_instances(normalize(img, 1, 99.8, axis=(0, 1)))

    separated = limnode.separateLabeledImage(labels)
    out[0].data[:, :, :, 0] = separated.astype(numpy.int32)

# child process initialization (when outproc is set)
if __name__ == '__main__':
    from limnode import print
    limnode.child_main(run, output, build)
OSError: [WinError 1314] A required privilege is not held ...
If this error happens the user has no right to create symbolic links.
Th easiest solution on Windows 11 is to Enable Windows Developer Mode:
Settings > System > For Developers > Developer Mode.
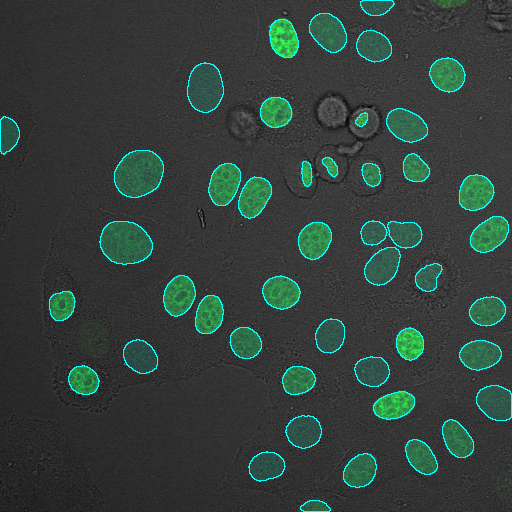
Figure 785. Stardist: Segmentation result.
Omnipose is a pupular general image segmentation package that builds on Cellpose.
Setup
In the GA3 node add:
- one channel input,
- one binary output,
- one channel output and
set the Execution mode to “Managed environment”,
insert the environment from the Environment section.
insert the code from Code section.
connect the input pin to the Channels output to be processed.
connect the binary output pin to the SavePictures node.
connect the channel output pin to the SaveBinaries node.
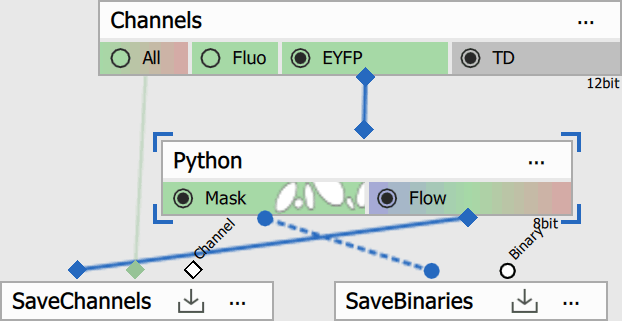
Figure 786.
Environment
Edit the environment and insert following definition:
CPU:
channels:
    - conda-forge
dependencies:
    - python=3.10.12
    - pip
    - pip:
        - omnipose==1.1.4
GPU:
channels:
    - conda-forge
dependencies:
    - python=3.10.12
    - pip
    - pip:
        - --index-url https://pypi.org/simple
        - --extra-index-url https://download.pytorch.org/whl/cu126
        - omnipose==1.1.4
        - torch==2.9.1
        - torchvision==0.24.1
        - torchaudio==2.9.1
Then install it by clicking the “Install managed environment” icon. Be patient it takes time.
The environment was created and tested in the January, 2026.
Tip
Consult with LLMs (e.g. ChatGPT) in case the versions do not work anymore.
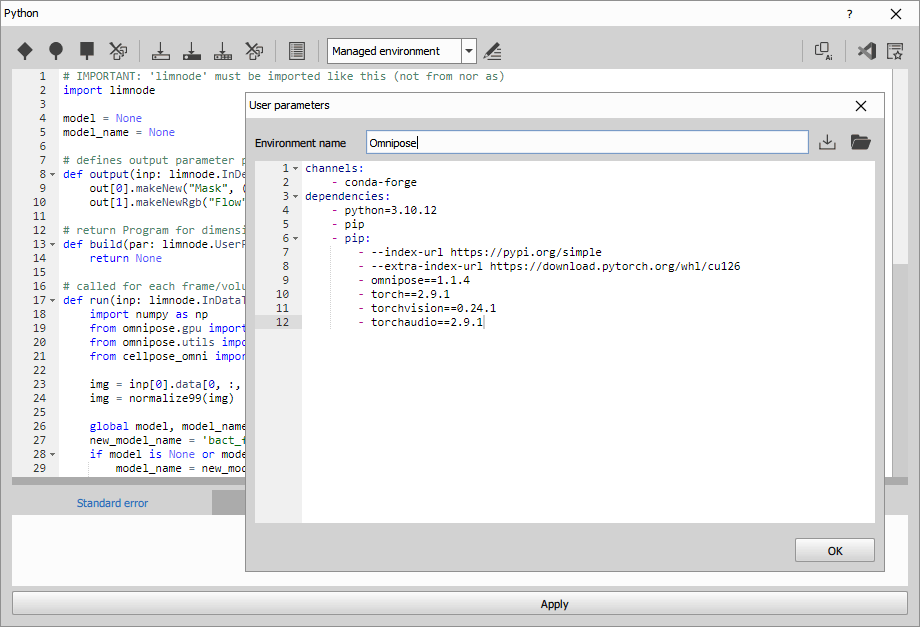
Figure 787. Omnipose: Managed environment.
Code
Insert the code as follows:
# IMPORTANT: 'limnode' must be imported like this (not from nor as)
import limnode

model = None
model_name = None

# defines output parameter properties
def output(inp: limnode.InDefTuple, out: limnode.OutDefTuple, par: limnode.UserParTuple) -> None:
    out[0].makeNew("Mask", (0, 255, 0)).makeUInt8()
    out[1].makeNewRgb("Flow").makeUInt8()

# return Program for dimension reduction or two-pass processing
def build(par: limnode.UserParTuple, loops: limnode.LoopDefs) -> limnode.Program|None:
    return None

# called for each frame/volume
def run(inp: limnode.InDataTuple, out: limnode.OutDataTuple, par: limnode.UserParTuple, ctx: limnode.RunContext) -> None:
    import numpy as np
    from omnipose.gpu import use_gpu
    from omnipose.utils import normalize99
    from cellpose_omni import models

    img = inp[0].data[0, :, :, 0]
    img = normalize99(img)

    global model, model_name
    new_model_name = 'bact_fluor_omni'
    if model is None or model_name != new_model_name:
        model_name = new_model_name
        gpu_device, is_gpu = use_gpu()
        if is_gpu:
            model = models.CellposeModel(gpu=(gpu_device, is_gpu), model_type=model_name)
        else:
            model = models.CellposeModel(model_type=model_name)

    params = {
        'channels':None,
        'rescale': None,
        'mask_threshold': -2,
        'flow_threshold': 0,
        'transparency': False,
        'omni': True,
        'cluster': True,
        'resample': True,
        'verbose': False,
        'tile': False,
        'niter': None,
        'augment': False,
        'affinity_seg': True
    }

    mask, flow, style = model.eval(img,**params)
    mask = limnode.separateLabeledImage(mask)
    out[0].data[0,:,:,0] = mask
    out[1].data[0,:,:,:] = np.where(mask[..., None], flow[0][:, :, 0:3], 0)[...,[2,1,0]]

# child process initialization (when outproc is set)
if __name__ == '__main__':
    from limnode import print
    limnode.child_main(run, output, build)
The code:
Initializes the global variable model so the model is created only once. [line 4]
Initializes the global variable model_name to track the currently selected model type. [line 5]
Defines a binary output named “Mask” and sets its display color to green. [line 8]
Defines a channel output named “Flow” and sets its format to 8-bit RGB. [line 9]
Checks whether a GPU device is enabled [line 30]
Creates the CPU model. [line 32]
Creates the GPU model. [line 34]
Runs the model on the current frame using the specified parameters. [line 52]
Splits the labeled mask into separate binary objects. [line 53]
Writes the resulting binary mask to the binary output [line 54]
Applies the binary mask to the flow image, converts RGB to BGR, and writes the result to the channel output. [line 55]
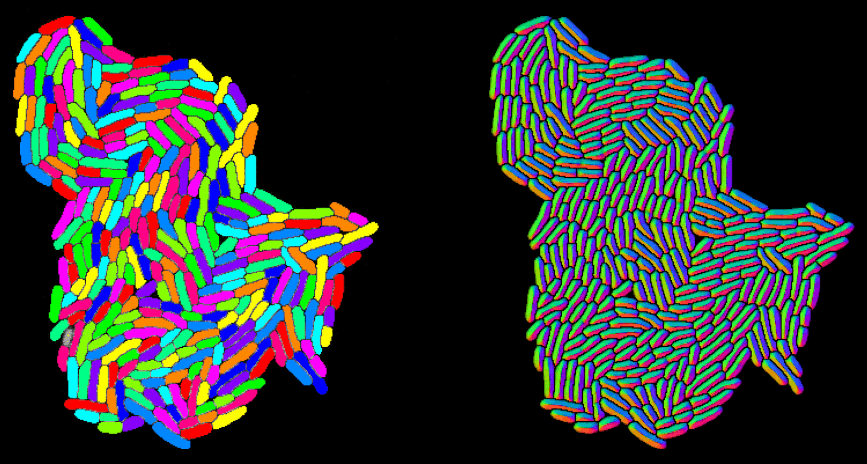
Figure 788. Omnipose: Binary Mask & RGB Flow.