The appearance and behaviour of the graph can be modified in the General Graph Properties window. Right-click inside the graph area and select the Options command from the context menu.
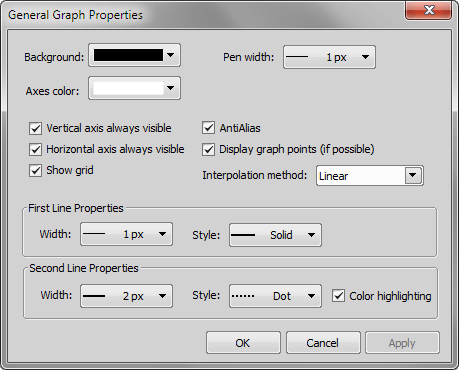
Figure 1586.
If checked, the axes do not leave the graph area while zooming in the graph.
The grid in the background may be or may be not displayed by selecting this option.
Turning this option on will make the graph line edges look smooth.
Small dots indicating the actual data values position can be displayed on the graph line. The points appear only if the distance between them is big enough for them to be recognized (they usually appear when you zoom in the graph).
The profile line shape may be smoothed out by using an interpolation method. Select one of the three available: Quick (basic), Linear (smoother), Bicubic (really smooth).
These settings (line width and style) are applied to the velocity and acceleration graph lines. The Color Highlighting option ensures that the two lines will differ in color.
Note
Basic graph properties such as object selecting, graph smoothing and data exporting can be performed from the context menu over the graph.