
(requires: SPT Processing)
Single Particle Tracking (SPT) module combines image analysis and trajectory statistics to understand the motion of functional molecules in the cytoplasm or in the nucleus. It tracks single fluorescent molecules at the molecule level and analyzes parameters of these tracks, such as the mean square distance value (MSD).
Start by opening the image for tracking (containing only t-dimension). To open the SPT analysis, run  Image > Analysis Explorer and click on the first combo box to select
 ![]() Single Particle Tracking and then click on its button.
Single Particle Tracking and then click on its button.
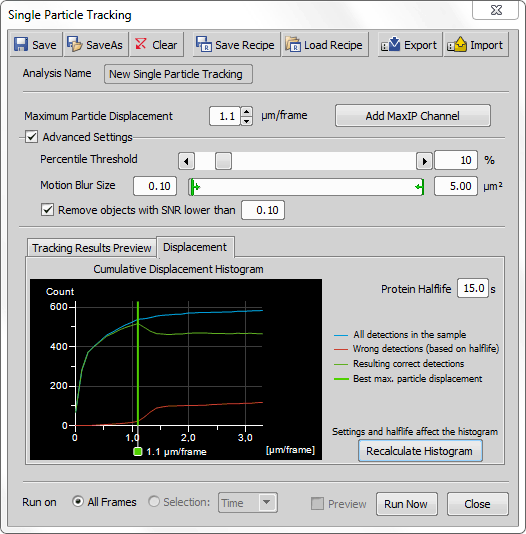
Figure 1601.
Dialog window options
 Save
Save Saves the new SPT settings into the Analysis Explorer or overwrites the previous settings of already saved analyses.
 Save As
 Clear
Clear Save Recipe
 Load Recipe
 Opens the Load Recipe dialog window enabling to select and load previously saved recipes.
 Export
 Import
This value represents movement of molecules between two consecutive frames. Suggested value is shown in the Cumulative Displacement Histogram.
Removes the mean intensity value from all frames to better visualize areas where particles may be present.
Thresholds the specified percentage value of the brightest pixels on each frame.
Single molecules are beyond optical microscopy visibility, therefore their movement is observed as a motion blur. Size of this blur can be specified to restrict the size of the molecules.
Removes objects with signal-to-noise ratio lower than a specified value.
Displays preview result values of the first 500, middle 500 and last 500 frames.
Click to view information in the Cumulative Displacement Histogram. Its legend describes the color lines. Vertical green line suggests the best numeric value for the Maximum Particle Displacement. Protein Halflife represents a time interval for how long the molecule emits light and therefore is detectable. Enter this value based on your tracked sample.
Once you set up the SPT dialog window and execute it clicking on , detected particles are shown in the image and tracking results are shown in the Tracking tab ( View > Analysis Controls > Tracking ![]() ). Visualization of detected binaries can be tuned inside the Display tab inside Advanced Tracking (Track Properties).
). Visualization of detected binaries can be tuned inside the Display tab inside Advanced Tracking (Track Properties).
Note
Next to the source ND2 file, two new .CSV files are created after the tracking is finished. First file contains information about each detected object (X[µm], Y[µm], FRAME NUMBER, TRACK NUMBER). Second file contains the overall result information (FILE NAME, NUMBER OF DETECTIONS, RELATIVE DENSITY [1/µm/s], NUMBER OF TRACKS, NUMBER OF CUT TRACES, MEAN SNR, MSD1 [µm], MSD2 [µm], MSD3 [µm], ... ).