This following graphics are reproduced from the following free access article:
Single-molecule tracking in live cells reveals distinct target-search strategies of transcription factors in the nucleus: Izeddin, Récamier, Darzacq et al., E-life, June 2014.
To a user point of view, this could be extracted from the name.csv file produced by I-SPT with further integration in NIS-Elements if demand is significant.
Below are the MSDs obtained by I-SPT of two molecules inside the nucleus: Dendra 2, which moves freely and H2b, a nucleosomal protein with reduced mobility:
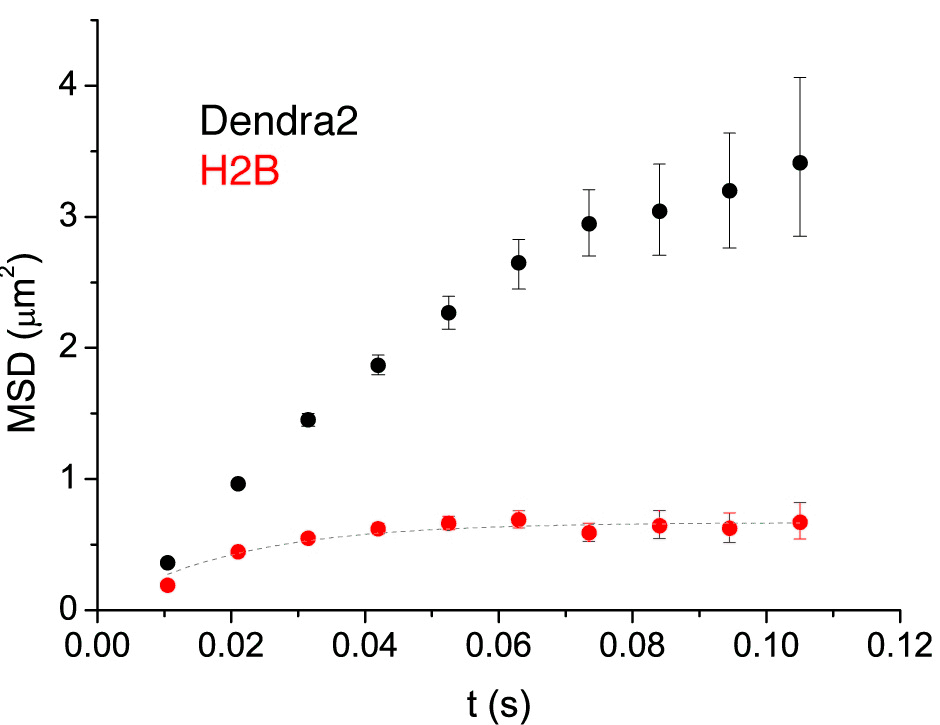
Figure 1468.
Here, the diffusion of Dendra2 is free with diffusion coefficient ~10µm² / s. H2b motion is sub-diffusive.
The step-translocation histograms are the bin distribution of distances for a given time-lag. As explained on Tracking session, the I-SPT translocation histograms may be corrected from tracking error (white bar).
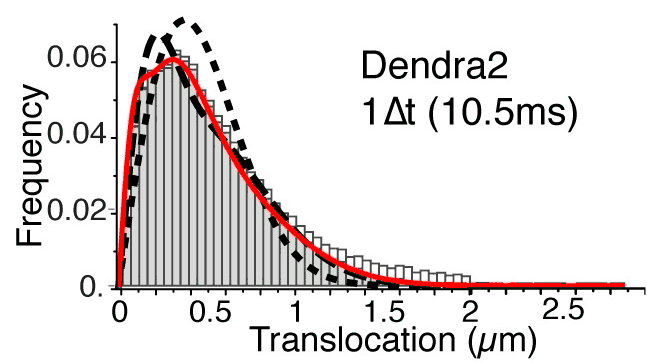
Figure 1469.
They also can be used to determine the number of different Brownian diffusing populations in the sample: 1 (do line), 2 (dash line or free (plain line).
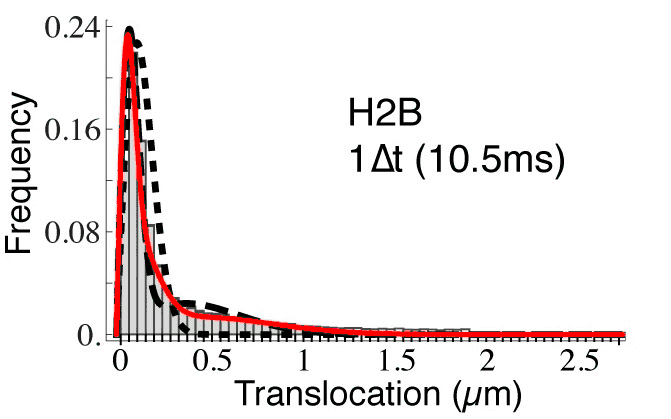
Figure 1470.
An angle is defined between two successive displacements for one or several time steps.
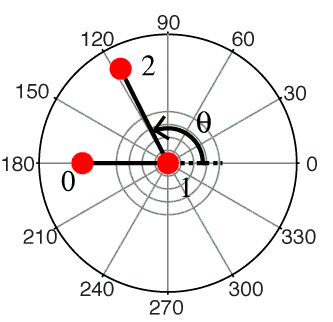
Figure 1471.
Plotting the distribution of the angles can give information on the geometry in the diffusion. Below are the step angle histograms of Dendra 2 with the isotropy characteristic of free diffusion:
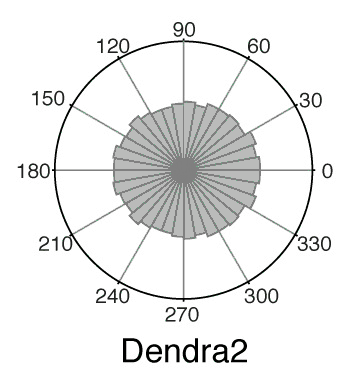
Figure 1472.