
This analysis is designed for counting organic cells. It operates on a single channel and produces one binary mask and a set of predefined features. It has similar functionality as the Object Count in NIS-Elements.
Start by choosing your optical configuration, selecting a color that is well visible in the preview image (check the Preview check box) and thresholding. The threshold bar enables selecting low and high intensity thresholds. Only the pixels within this interval will be taken to make objects visualized as a binary mask.
Under the main Threshold bar there are four post-processing controls to further tweak the objects (Smooth, Clean, Fill holes, Separate). If the objects are too rough it is a good idea to try some smoothing, but not too high values in order to avoid merging of nearby objects. Then use little bit of Clean to get rid of the smallest objects. Set Fill holes if it makes sense in your sample. And finally play with Morphological separate (higher numbers separate less – produce bigger objects). You can filter the objects based on their Size (EqDia – Equivalent Diameter: calculated from object area as if it was a circle) or Circularity. Then you can check each feature you want to measure. Following features are available: Area, Eq. Diameter, Circularity, Elongation, Length, Width, Max Feret, Min Feret, Mean Intensity, Sum Intensity, Perimeter. For their detailed description please see Measurement Features. If your object size does not differ, you can Use object standard size. Object count field shows the number of objects detected on the current frame using the current analysis settings. Finally you can choose whether to Save features for each object and confirm the analysis setting by clicking .
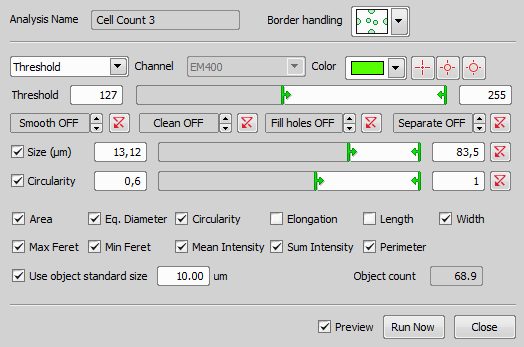
Figure 526. Redefinition window for the “Cell count” capture type.
Window Options
The top buttons which are common to all analysis windows are described in the Analysis chapter.
Options concerning Threshold are already described in the General Analysis chapter.
 Include objects touching image borders
 This function takes all objects touching the border of your image into the analysis.
 Exclude objects touching image borders
 This function excludes all objects touching the border of your image from the analysis.
 Include objects touching top or right border
 This function includes all objects touching the top or right border and excludes all objects touching the bottom or left border of the measurement frame. The frame size can be adjusted by entering a numeric value [µm, %] which defines width of the outside margin.
 Single point threshold tool
 (requires: JOBS)
This tool picks threshold from the image based on single pixels. Click in the image and define one or more points of interest. Then use the mouse right-click to confirm the selection. Threshold is calculated automatically based on your selection.
 3 points circle threshold tool
 (requires: JOBS)
Click inside the image to define typical object areas - in this case threshold from the radius of 3 pixels is used. The system detects similar parts of the image and highlights the resulting thresholded area by a selected color.
 6 points circle threshold tool
 (requires: JOBS)
This tool is the same as the previous one besides using 6 pixel radius.
Select features to be measured.
In some circumstance it is not possible to consistently threshold individual objects. If it is priori known that the object size does not vary significantly, it is possible to use the Standard object size (EqDia) feature to determine consistent count. The count is then calculated as a ratio of total area under mask and the Standard object area (calculated from its size).
If this check box is checked, features are saved for each object detected by the Cell Count analysis.
After defining the Cell Count and clicking , you can use parameters resulting from this analysis to define an expression. The parameters are then available in the Define Expression window under the “name of your Capture task” / Analysis / “name of your Cell Count”.
Cell Count analysis generates one binary mask accessible after opening acquired images. Following set of features is always saved into the database:
| NAME | TYPE | DESCRIPTION |
|---|---|---|
| Count | Field | Object count |
| Area | Field | Area of all objects under the mask |
| AreaFraction | Field | Ratio of Area to the whole Field Area |
| ObjectArea | Object | Individual Object Area |
| ObjectEqDia | Object | ObjectEqDia Object Individual Object EqDia |
| ObjectMeanIntensity | Object | Individual Object Mean Pixel Intensity |
| ObjectSumIntensity | Object | Individual Object Sum Pixel Intensity |
All the object features (ObjectArea, ObjectEqDia, ObjectMeanIntensity and ObjectSumIntensity) produce following aggregated statistics: Mean, Min, Max, Sum, StDev (as member variables). In the expression they appear this way:
| Job.CaptureName.Analysis.CellCountName.FieldFeature |
| Job.CaptureName.Analysis.CellCountName.ObjectFeature.Mean |
| Job.CaptureName.Analysis.CellCountName.ObjectFeature.Min |
| Job.CaptureName.Analysis.CellCountName.ObjectFeature.Max |
| Job.CaptureName.Analysis.CellCountName.ObjectFeature.Sum |
| Job.CaptureName.Analysis.CellCountName.ObjectFeature.StDev |
Where CaptureName is the name of the capture task, CellCountName is the name given to the CellCount analysis, FieldFeature is Count, Area or AreaFraction and ObjectFeature is ObjectArea, ObjectEqDia, ObjectMeanIntensity, ObjectSumIntensity.
See also Using Expressions.