
This analysis measures cell growth in time. A simple timelapse-only ND2 file must be open for this command to be enabled.
Options
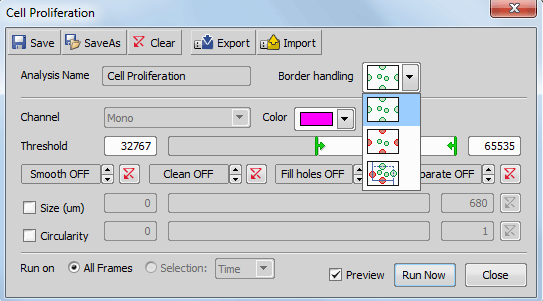
Figure 528.
Select which recipe (a collection of settings) is used for the task from the pull down menu. You can also Load another recipe you have previously created or get. When you made some changes to the recipe, you can either Save them to the currently selected recipe, or Save As a new recipe.
 Include objects touching image borders takes all objects touching the border of your image into the analysis.
 Exclude objects touching image borders excludes all objects touching the border of your image from the analysis.
 Include objects touching top or right border includes all objects touching the top or right border (frame) and excludes all objects touching the bottom or left border (frame) of your image. The frame restricting your cell count area can be adjusted from the outside by entering a numeric value [µm, %] or by dragging the yellow lines in your live image.
Select which channel is analysed.
Choose color of the binary layer.
Use the sliders to define the thresholded objects. You can also overwrite manually the values of thresholding limits.
You can apply some of the binary operations to improve the thresholded binary image. Use the Preview check box to view results of the current settings in your active image.
You can filter the detected binary objects using the Size or Circularity restriction filters.
Select which dimension is used for the analysis.
Check to display preview of the result.
Starts the task and displays the  View > Analysis Controls > Automated Measurement Results
  window and the Measure > Time Series Graph with the results.
Cancels the task and closes the window.