Start the application by
 Applications > Metallography > Grain Size.
Click the
 Grain Size Wizard button in the main tool bar.
A dialog window appears. Select the Comparison Charts measurement method.
Specify settings for the selected Image data source - see Grain Size Wizard - Start.
Click the button. A new full-screen window appears displaying the first image of the data source and a set of (ISO 643) comparison charts.
The image is now displayed in one of the supported total magnifications (physical zoom). Its value is displayed in the tool bar next to the zooming buttons. The
 Optimal Zoom button zooms the image to the nearest supported magnification which fits to the screen. The
  Zoom 100x button sets the magnification to 100x.
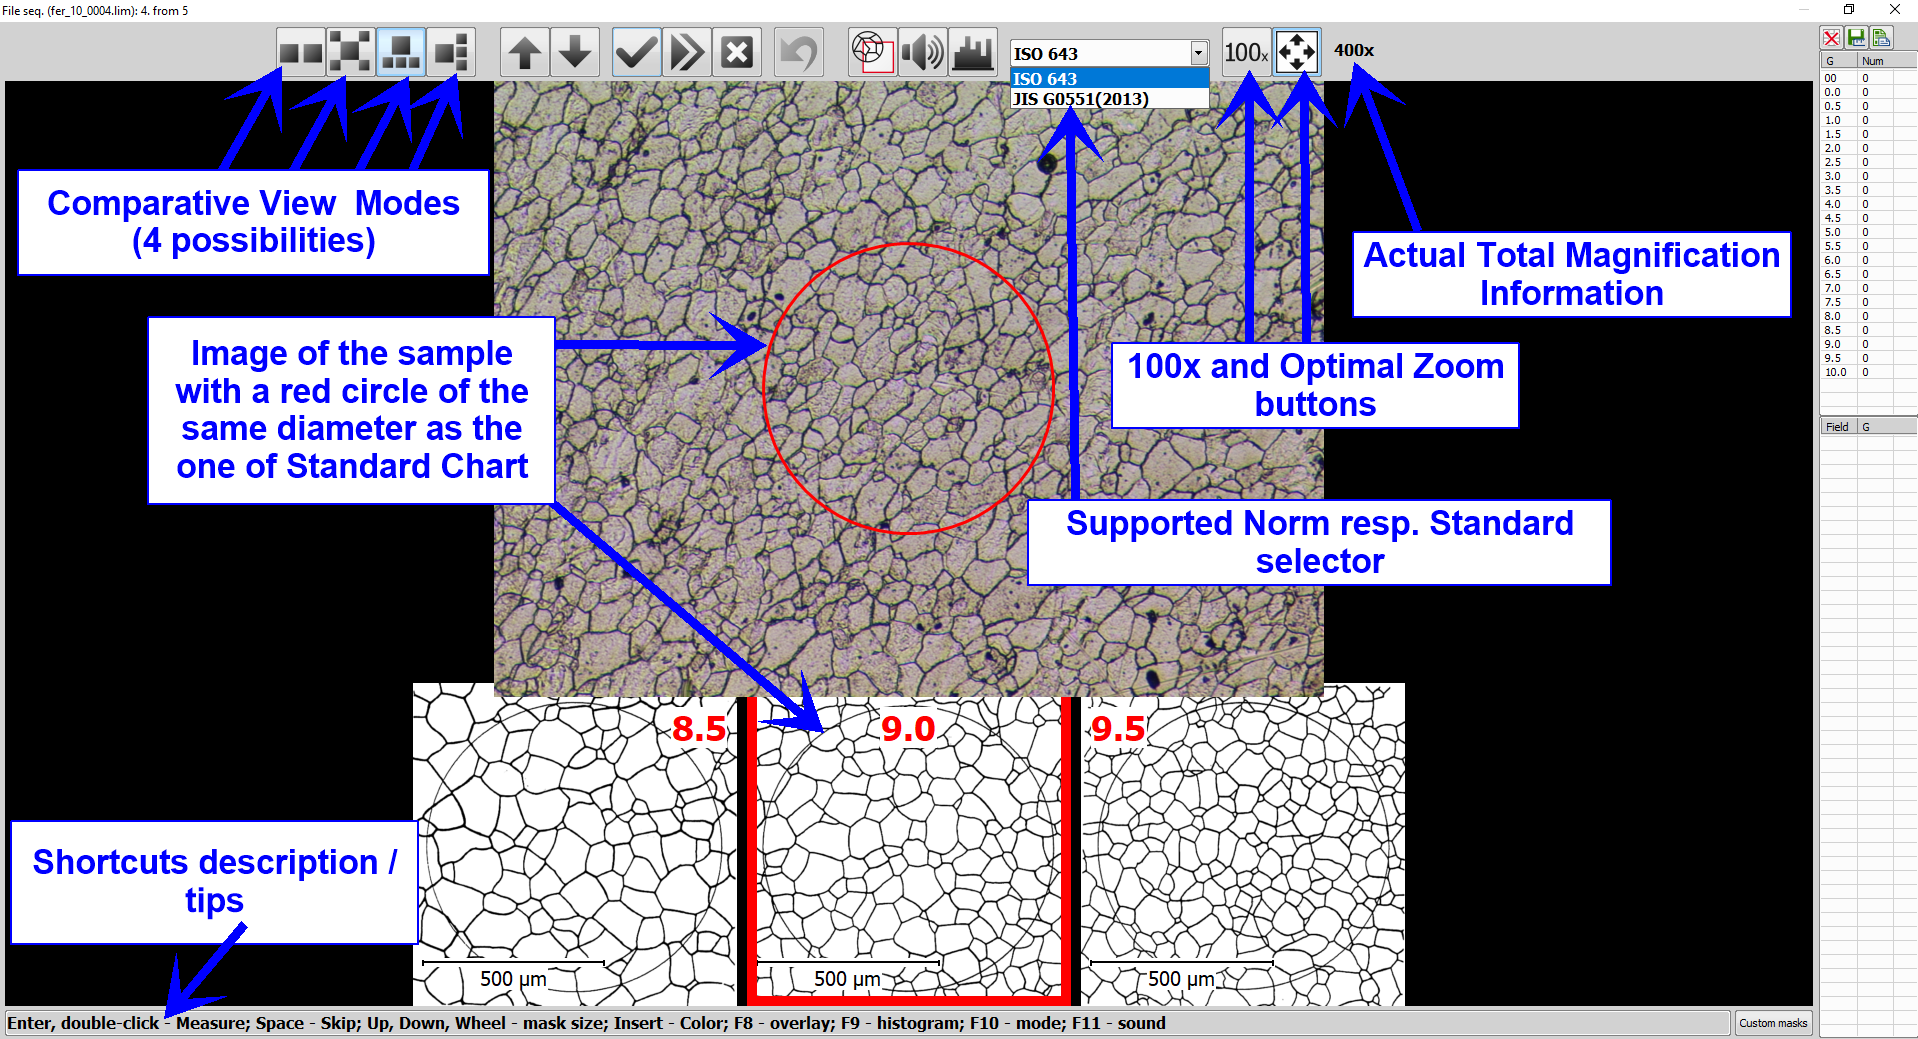
Figure 400.
One or more standard charts appear next to the image based on which comparison mode is selected in the tool bar. The
 1:3 vertical comparison mode is used in the following example.
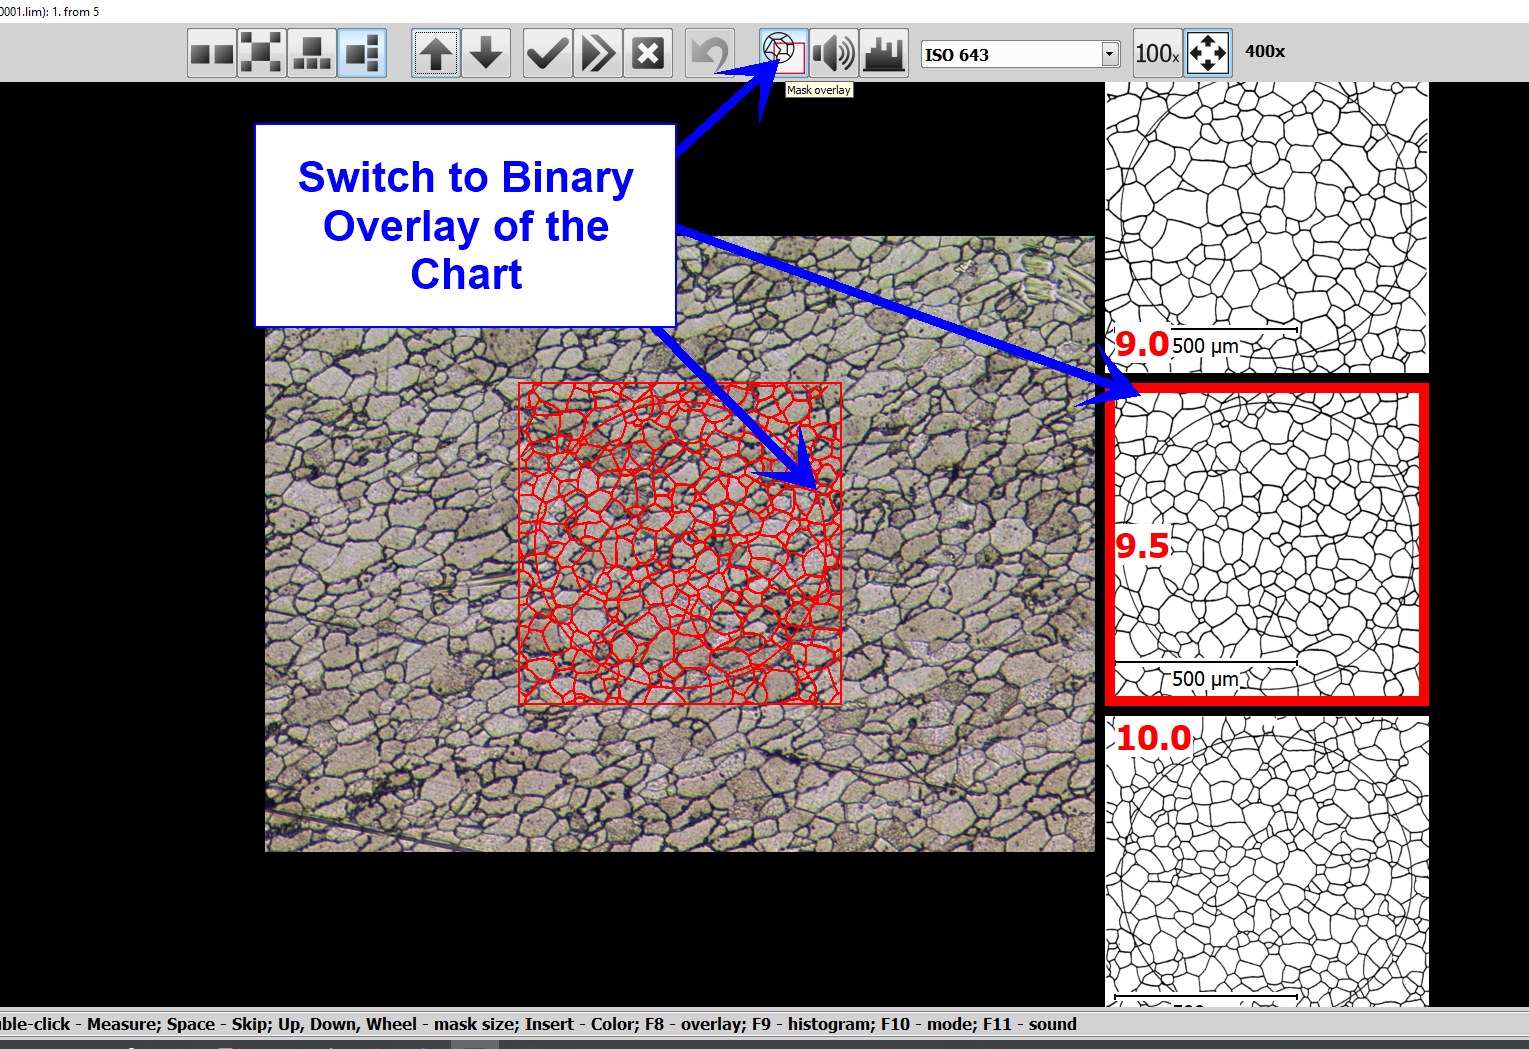
Figure 401.
The middle chart with the red border is the one whose value will be appended to the result table once you confirm the current measurement. Compare the chart with the image visually. If found useful, click on the
 Mask overlay button to display chart contours over the image. You can move the contours around the image by mouse.
Use mouse wheel or the up/down arrow keys to display charts with lower or higher grain size values. Once you find a chart with matching grain size, click the
 Measure and new frame.
The grain size value is appended to the result table on the right, a corresponding frequency bin in the top right histogram table is increased by 1 and measurement of the next field is started.
Tip
Should the current image for whatever reason be excluded from the measurement, click on the
 Skip and new frame button, no data will be added to the result table.
Tip
In case you realize a mistake was done, you can always use the
 Undo last measurement button to delete the last one or more measurements. If the Image data source is a folder or an ND2 file, the button also loads the corresponding image so that it could be re-measured.
The measurement will be finished if:
all images in the selected folder are measured,
the user clicks the
Finish Measurement button.
Having measured all the fields or having terminated the measurement, you will be prompt to create a report or to exit the measurement:
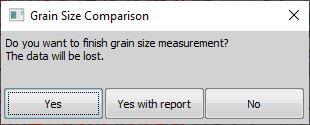
Figure 402. Manual finish
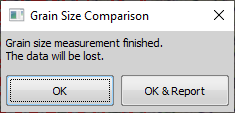
Figure 403. Automatic finish
YesThe comparison window will close and the current data erased!
Yes with report, OK & ReportAll data will be passed to the reporting engine and the comparison window will close.
NoThe measurement will continue with all previously measured data available.
Select to create a report.
Fill in the Report Info window and click on the Report button to create the report.
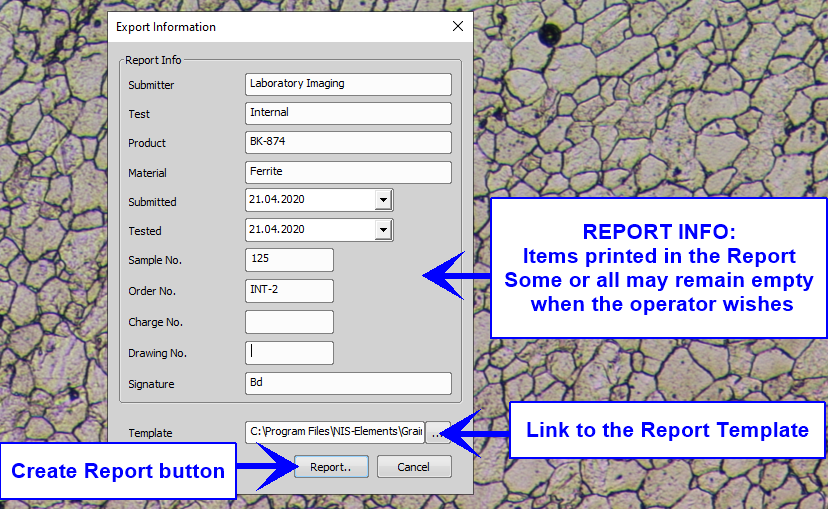
Figure 404.
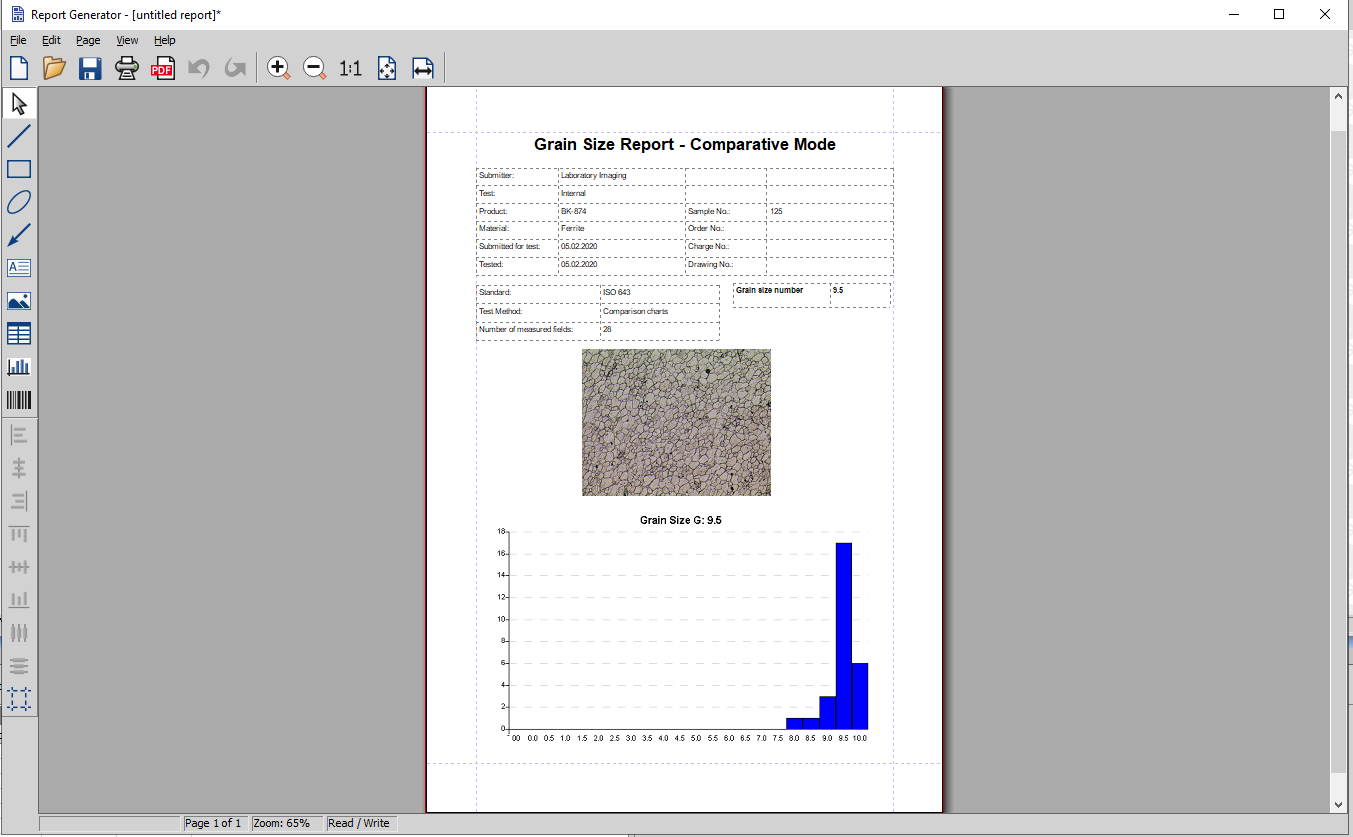
Figure 405. Example report
Save the report to a *.rpt file readable by NIS-Elements or export it to *.pdf or *.rtf.
