This “how to” expects you to have correctly captured Donor-only, Acceptor-only, and FRET-sample images.
See also: FRET.
Summary
Use the Create FRET Image from Files dialog to build a new .ND2 file of the 4 component images from the donor only sample.
Use the Create FRET Image from Files dialog to build a new .ND2 file of the 4 component images from the acceptor only sample.
Using the FRET Calibration dialog, use the .ND2 files from steps 1 & 2 to draw ROIs and generate FRET Coefficients.
Use the Create FRET Image from Files dialog (which now has all of the coefficients imported automatically into it from step #3) to generate a FRET .ND2 file from the component images of the FRET sample (there are 2 sets of images to try).
Determine the mean FRET efficiency of the cells using the ROI statistics dialog.
Procedure
First, create an .ND2 file from the donor only images (control images) using the Create FRET image from Files dialog. See Applications > Ratio, Ca2+, FRET > Create FRET Image from Files.
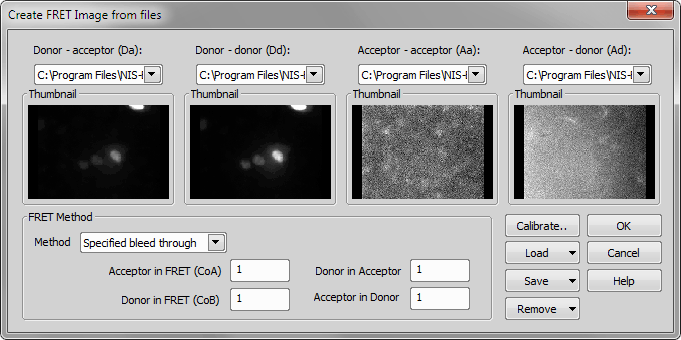
Figure 646.
An .ND2 FRET image will be created for the donor-only sample. Keep it open and available.
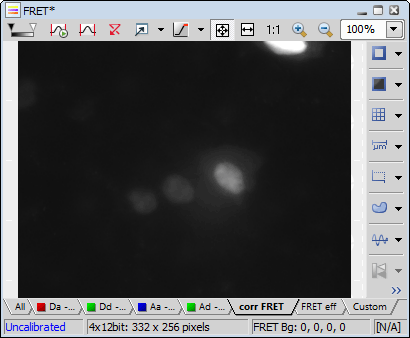
Figure 647.
Next, create an .ND2 file from the acceptor only images (control images) using the Create FRET image from Files dialog
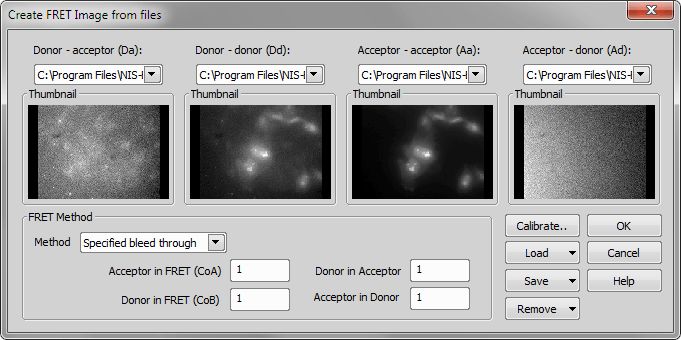
Figure 648.
An .ND2 FRET image will be created for the acceptor-only sample. Keep it open and available.
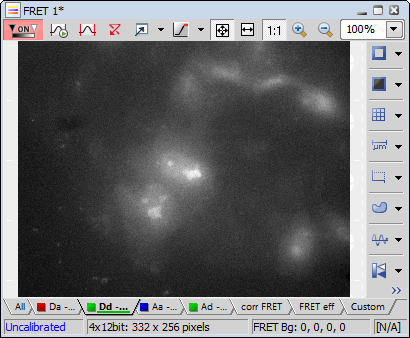
Figure 649.
Open the FRET Calibration dialog (Applications > Ratio, Ca2+, FRET > FRET Calibration0), and choose the appropriate .ND2 to use for the donor and acceptor only images. All open documents appear in the drop-down menu.
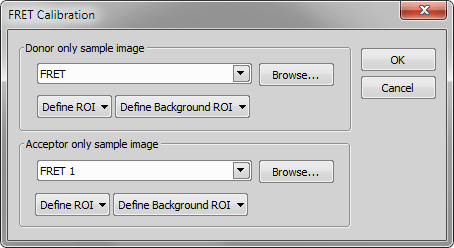
Figure 650.
Create ROIs and a background ROI in the donor only sample .ND2 image. Use the Define ROI and Define Background ROI buttons from the dialog window.
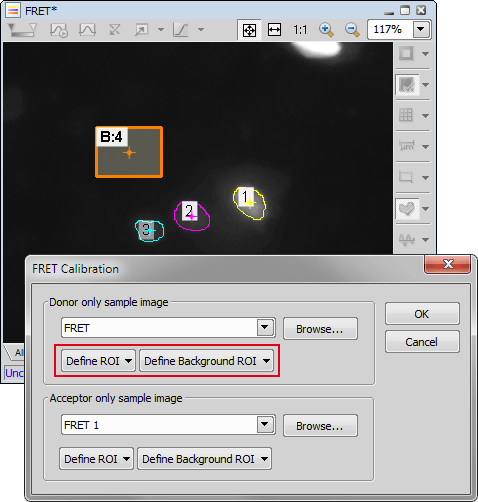
Figure 651.
Create ROIs and a background ROI in the acceptor only sample .ND2 image and click .
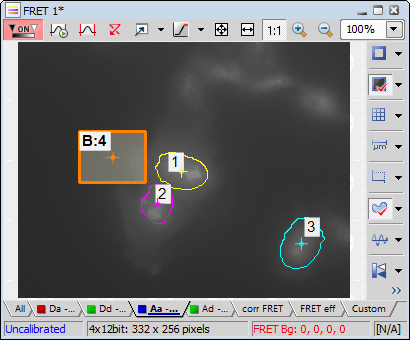
Figure 652.
Hitting will open the Applications > Ratio, Ca2+, FRET > Default FRET Coefficients dialog and fill the FRET coefficients fields. Confirm it with .
Now re-open the Create FRET Image from Files dialog. Note the calibrations have been imported. Use the dialog to create an .ND2 file of the FRET sample image
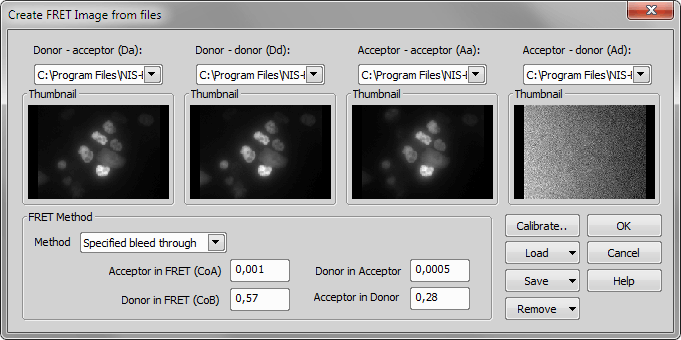
Figure 653.
A new .ND2 file of the FRET image will be created, with tabs for all individual components. There will also be tabs corr FRET for corrected FRET and FRET eff for FRET efficiency.
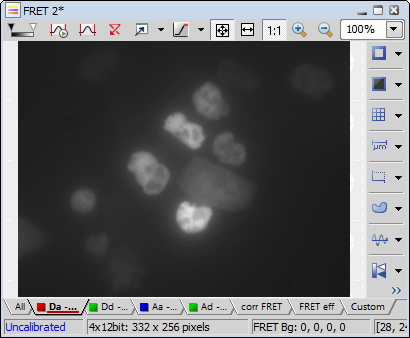
Figure 654.
Clicking on the FRET eff tab will give a pseudocolored image with a scale
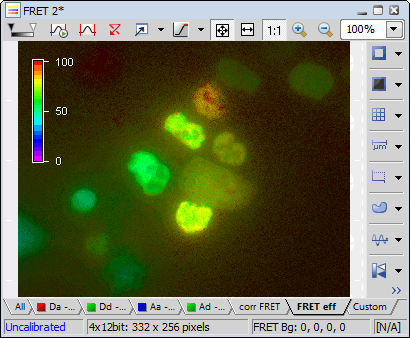
Figure 655.
You can use ROI statistics (see View > Analysis Controls > ROI Statistics
 ) to visualize FRET efficiencies. You can also draw ROIs around cells of interest if necessary
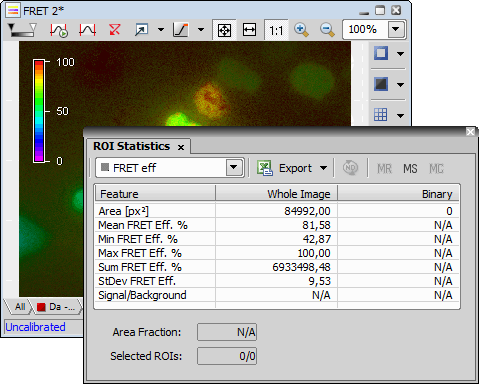
Figure 656.
Intensity Profile (see View > Analysis Controls > Intensity Profile
 ) will also output FRET efficiency along a line when the FRET eff tab on the image is selected.
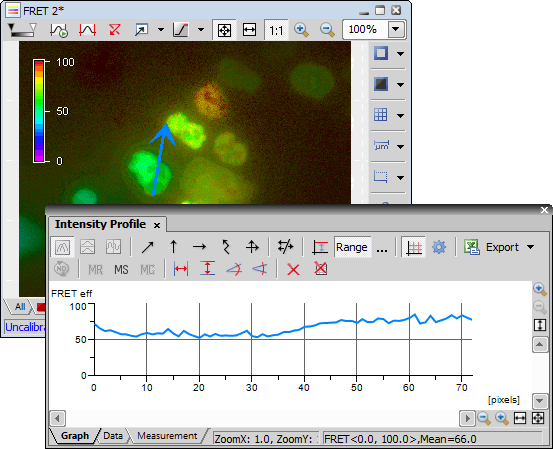
Figure 657.