
The Calcium and FRET module provides methods for an efficient calcium ion concentration measurement.
See also Ratio Experiment, Calcium Calibration.
Ratio Experiment Commons
Usually, Fura-2 ratiometric fluorescent dye which binds to free intracellular calcium is used.
Fura-2 is excited at 340 nm and 380nm
Ratio of Emission of 340 and 380 correlated to the amount of intracellular calcium
The ratio of the emissions at 340 and 380 wavelengths is directly correlated to the amount of intracellular calcium
Why Use a Ratio? Because it is not as sensitive to changes in:
Dye concentration
Auto fluorescent background
Focus Drift
Ambient Lamp
Procedure
Define ROIs for the Ca 2+ measurement.
Perform Time Measurement either during an ND2 experiment or on an existing ND2 file.
Turn Ratio View ON (
 Applications > Ratio, Ca2+, FRET > Ratio View).
Go to the Time Measurement window and display the ratio graph in the Channels
 mode.
mode.Press the Define Calcium Calibration
 button within the time measurement control panel to pick the calibration values from the graph.
A wizard starts. Follow its instructions - pick the R min a R max values from the ratio graph.
The [Ca2+] graph display becomes available to be displayed in the time measurement window.
The [Ca2+] image channel view is created within the ND2 file. It visualizes the Ca2+ ion concentration via a color scale.
Ratio View Properties - Calcium Calibration settings
If you prefer to modify the Calcium Calibration by hand, run the Applications > Ratio, Ca2+, FRET > Ratio Properties command. In the window that appears select the Use [Ca2+] calibration check box (or it is already selected if the calibration procedure was performed beforehand). The Calcium Calibration tab appears.
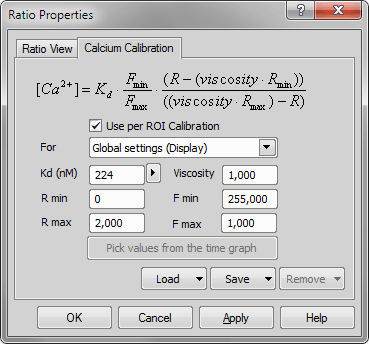
Figure 628.
All constants necessary for calcium ion concentration calculation can be defined manually within the Ratio Properties window, either for each ROI separately or globally (the Use per ROI Calibration option). Use the to pick R min / R max constants from the Time Measurement graph - the time measurement must have been performed before. The F min / F max values will be computed automatically.
Concentration of Calcium in nanoMoles.
Dissociation constant: 135nM at 20ºC, 224nM at 37ºC
Ratio of 340/380 intensity at the current time point
“Constant” between 0.7 and 1.
The minimum ratio value of the experiment
The maximum ratio value of the experiment
The calibration settings can be saved for further use by the Save button (and loaded later by the Load button).