
The filter is scanned and the image is saved as a filter image database file (.flt). This file contains all information about the scanned filter. See Filter Scanning.
Scanned filters can be measured, i.e. analyzed, immediately or later. This is usually done on the same computer. Optionally, to speed up the process, you can scan the images on one computer and use a different computer for measuring. See Defining Detection, Automatic particle measurement
The results are displayed directly in the application, a report can be created easily, or the data can be exported to MS Excel. See Displaying Results and Creating Report.
Run the application by clicking  in the top toolbar or via
  Applications > Filter Particle Analysis > Start Application .
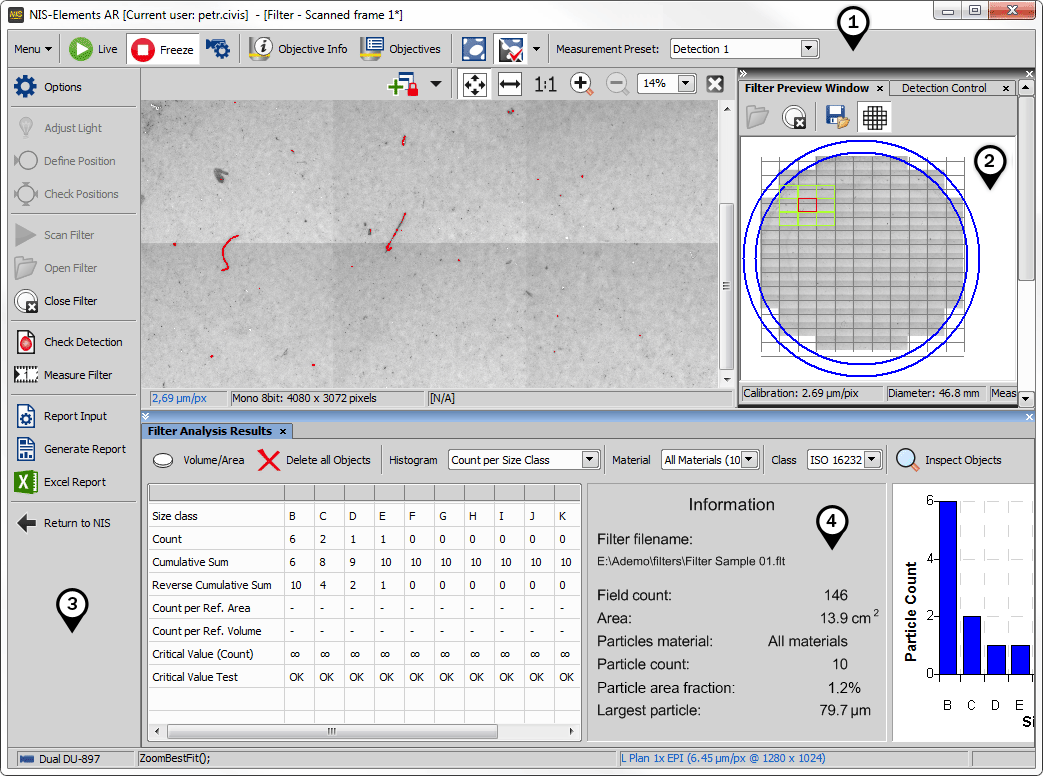
Figure 373.
The top horizontal toolbar contains commands for controlling the camera, objective calibration, binary layer visibility and the detection preset.
The right pane contains multiple docked tabs. The filter preview tab displays a preview of the filter being analyzed and enables you to open single image frames with their surroundings. The Detection Control tab defines the thresholding parameters for the filter measurement. See Defining Detection. Camera settings tab and microscope control tab can be reached from this pane as well.
The left toolbar contains tools in a logical order to guide you through the whole analysis procedure: adjusting illumination intensity, filter definition, scanning, measurement and report creating.
 Options reveal further settings.
The Filter Analysis Results panel placed at the bottom displays tabular data of the measured features. See Displaying Results.