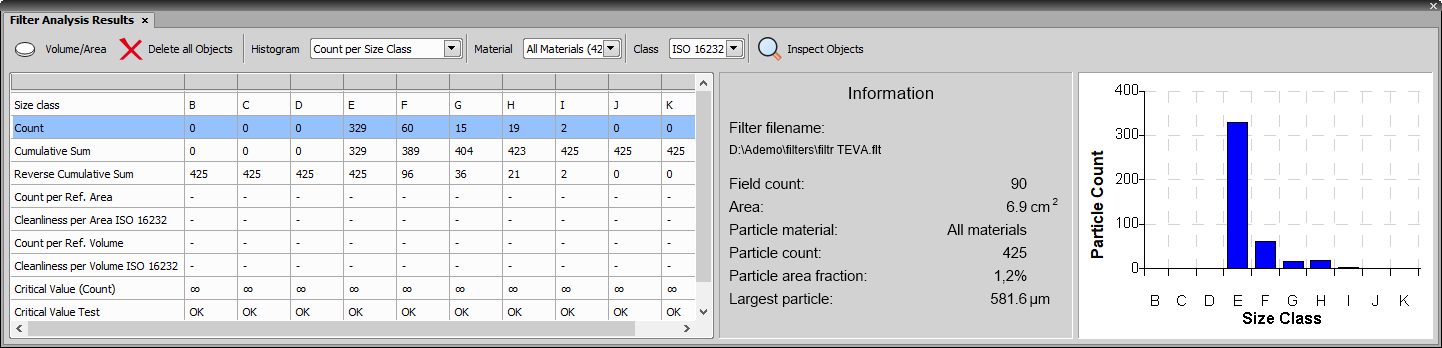
When the filter analysis is finished, the Filter Analysis Results tab is automatically updated:
The following features are measured and displayed in the Filter Analysis Results tab:
Size Class Name of the size class.
Count Total particle count in each size class.
Cumulative Sum Cumulated particle count in each size class calculated in the direction from the smallest to the largest sizes.
Reverse Cumulative Sum Cumulated particle count in each size class calculated in the direction from the largest to the smallest class.
Count per Ref. Area Particle count recalculated to a reference area.
Count per Ref. Volume Particle count recalculated to a reference volume.
Critical Value (Count) Critical particle count which distinguishes whether the filter passes the test or not.
Critical Value Test Result of the critical value test.
In the middle portion of the tab, the following information is displayed:
Filter filename Name of the analysed filter.
Field count Count of the analysed fields.
Area Area of the analysed filter surface.
Particle material Material of the detected particles.
Particle count Total count of all detected particles.
Largest particle Size of the largest detected particle.
The right portion of the tab displays a histogram. Choose the type of data which shall be used for the histogram calculation in the Histogram combo-box. The displayed histogram corresponds to the data in the left table and can be changed by clicking on the appropriate row in the table.
The option selected in the Material pull-down menu determines which material is used for the statistics. Calculated results depend on the selected Size class which are defined in the Data tab (Size Classes Setup...) inside  Options. Changes made to this table automatically update the measured results.
 Volume/Area
 Displays a dialog box, which defines the wetted/reference area and volume and the number of components. This information can be used for calculating additional statistics.
 Delete all Objects
 Deletes all detected objects.