
(requires: Local Option)
Note
The Molecule Analysis panel is included in the software as a trial version. Local Option must be installed to display it.
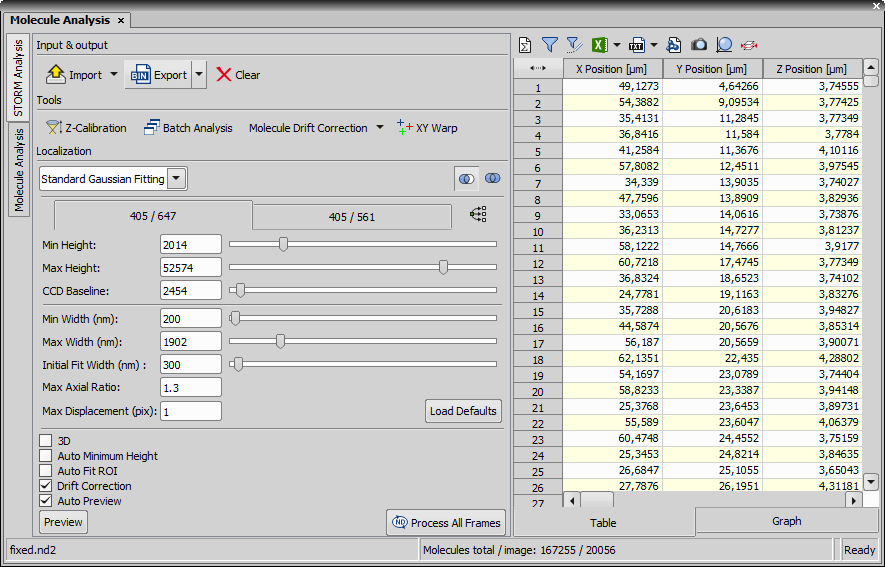
Figure 1417.
This dialog window is used for localizing molecules.
STORM Analysis
This tab is used for defining parameters influencing the molecule localization.
Tandem dye pairs tend to spontaneously blink simply under reporter wavelength excitation without any activation. This phenomenon contributes localizations to Non-Specific Activation channel (further NSA) when fluorophores self-activate in frames that don't immediately follow activation (frames 2, 3 and so on). When the same happens in frame 1 the software can not immediately distinguish between specific and non-specific activation. All localizations registered in frame 1 are initially assigned to its corresponding specific channel. During crosstalk calculation software can evaluate the (per frame) local rate of non-specific blinking and then statistically remove molecules based on ratio of local density between given specific channel and NSA. This kind of crosstalk removal is a mandatory part of any subtraction.
The second kind is called Cross Activation. It occurs between certain types of activators and activation laser lines. For example Cy3 designed to be activated by 532 nm laser can be accidentally cross activated by 457 nm laser typically used for activating Cy2. This results in some Cy3 molecules appearing in the imaging frame following 457 nm activation. Once again there is no immediate way for software to recognize this during STORM analysis so these cross activated Cy3 molecules are logged as Cy2. Crosstalk probability algorithm calculates the odds of any registered Cy2 molecule being indeed a cross activated Cy3. Similar to NSA cross activation probability is calculated based on local densities around given molecule. It is also affected by the ratio of activation laser power between 457 and 532 nm laser lines. The probability calculation assumes that activation laser powers remained constant during acquisition. Cross activation subtraction is only available for data sets or their portions where this assumption holds true. Laser power changes are tracked and recorded in metadata during acquisition. Use period slider and buttons tool tips to find a data set range with constant activation laser power ratio. Cross activation crosstalk typically holds a much smaller share in comparison with NSA crosstalk.
 Import
 Imports molecules that were exported from NIS STORM (.txt, .bin) either to the Current image or to a New image.
 Export
 Exports the molecules to a text file (ASCII), M425 BIN (.bin), N300 BIN (.bin), ND2 (.nd2), Frame lists (.txt) or Trace lists (.txt). Advanced options export the detected molecules data without the Z coordinate (Export without Z coordinate (flatten)).
 Clear
Clear Deletes all detected molecules.
 Batch Analysis
 Opens the Batch STORM dialog window. For more information please see Batch Analysis.
 Z-Calibration management
 Opens the Z-Calibration dialog allowing the user to view and/or change current calibrations used in determining the Z location of all molecules identified during STORM Analysis. For more information please see Z-Calibration.
 Molecule Drift Correction
 If the sample moves in time during acquisition, this function can compensate for the drift. For more information please see Molecule Drift Correction .
 XY Warp
 Performs XY Warp calibration using information extracted from a multi reporter Z Calibration file. For more information please see XY Warp.
 Configure/Launch cross talk analysis
 Opens the Crosstalk Options setting the Cross Activation and Search Radius (nm).
Cross Activation coefficient value at the top is used for probability calculation using constant activation power method. Default empirically determined value of 0.1 is valid for combination of 460 nm (Cy2) and 532 nm (Cy3) activation laser wavelengths. For other wavelengths (488 or 561) this value needs to be calibrated.
Crosstalk subtraction is a software technique that enhances the multi-channel STORM image appearance by reassigning the channel membership for (an ideally small) subset of molecules in overlapped areas based on local probabilities. For each molecule the software calculates probabilities of it not belonging to its current channel.
There are two types of crosstalk:
Since NSA crosstalk is usually dominant and mandatory to remove the cross activation crosstalk removal is optional, but (if selected) always applied in combination with NSA subtraction. For such combined removal calculated probabilities (NSA and Cross Activation) are summed for each molecule. Molecules removed from their original specific channels are placed into a temporary “Non Specific Activation-Xt” channel. Ultimately they are destined to general NSA channel once the results are confirmed.
Cross talk subtraction is not available for data acquired using spontaneous activation. The criterion for launching crosstalk probability calculation at the end of STORM analysis is the presence of NSA molecules.
Since crosstalk probabilities calculation relies on molecules’ XY positions it is highly recommended to perform crosstalk subtraction after drift correction. For 3D data sets Z position is also considered by default but can be optionally disabled.
Crosstalk probability calculation is based on local densities around any given molecule. Local densities are essentially counts of neighborhood molecules. The choice of neighborhood size is a tradeoff between the resolution and statistics accumulation. Naturally the neighborhood is round as we track Cartesian distance. If the radius is large the resolution of resultant image is degraded in the crosstalk subtracted areas. If on the other hand the radius is too small the neighbor molecule counts quickly become insufficient for statistical analysis. Crosstalk Settings dialog maintains a list of search radiuses to be tried for probability calculation. Crosstalk Settings dialog is mutually exclusive with Crosstalk Subtraction dialog and is available via the button only when no data is loaded.
Default radius choices are 25, 50, and 75 nm. Any of them can be removed and new values can be added. To add a new value type it in the edit box on the left and press the (add) button or press Enter. To remove one or more of the existing radiuses highlight them in the list on the right and click (remove) button or press Delete key. Multiple selection follows standard Windows convention with Ctrl and Shift. To replace one or more highlighted list values with a new one typed in the edit control hold Shift while clicking the (add) button. The software does not allow accepting the changes while the list is cleared. At least one radius is mandatory.
Duplicate entries are not allowed. An attempt to add a duplicated entry is ignored. Radiuses less than 5 or more than 5000 nm are invalid. The following validation warning enforces the range. Large radius values as well as extra number of different radius values increase the probability calculation effort. There is no hard limit to the total number of different radius values but the following warning is displayed when it exceeds three.
Select a localization method suitable for your sample.
Localization parameters can be set either for each channel separately (switch to the proper channel tab) or they can be taken from the current channel and applied to all channels by clicking  Apply channel settings to all channels.

Replaces the old molecules with the newly detected.

Keeps the old molecules and appends the newly detected.
Intensity of the smallest (dimmest) peaks (minus the local background of that peak) to be identified as molecules. Any object whose peak intensity is below this value will not be identified.
The intensity of the largest (brightest) peaks to be identified as molecules. Any object whose peak intensity is above this value will not be identified.
Closed shutter (zero photons) pixel response. For Andor DU-897 and for Hamamatsu Orca-Flash 4.0 cameras it should always be 100.
The smallest possible width a spot of some intensity in the image can have to be identified as a molecule.
The maximum possible width a spot of some intensity in the image can have to be identified as a molecule. A suggested default value for 2D is 400 nm. For 3D STORM, this should be slightly larger to take defocused molecules into account (molecules above and below the focal plane). A suggested default value for 3D is 700 nm.
This value is used as a starting point for STORM Analysis for identifying molecules. For 2D STORM, this is the expected value of a diffraction limited spot. A suggested default for both 2D and 3D is 300 nm.
Fluorescent spots whose ratio of elongation in the X and Y direction is larger than this threshold will be rejected as a single molecule. It is typically set to 1.3 for 2D STORM and 2.5 for 3D STORM.
This value sets the maximum distance (in pixels) that a molecule identified in one frame can be located from a molecule identified in the previous frame to be considered the same molecule and arising from the same activation frame. The default value is 1.
Enters default values into all edit boxes of this dialog window.
This function is used to analyse the molecule image as it contains 3D molecules. Different parameters than in 2D are set and a request for switching to the recommended settings is shown.
If checked, this function performs automatic min height detection during analysis. When auto min height is selected the software runs a short (100 periods in the middle of selection range) pre-analysis with relaxed identification constraints to determine the optimal min height for a given data set. This feature is not available when a Z Calibration data set is loaded.
Check this checkbox to allow fitting algorithm consider variable number of pixels depending on width and axial ratio of each individual peak. When this check box is cleared a fixed size pixel rectangle (typically 5 x 5 pixels) is used for fitting. Auto Fit ROI is recommended for 3D analysis. Fixed size ROI is recommended for 2D analysis.
Captured sample may sometimes slightly move in one direction (e.g. due to temperature). Turn on this feature to calculate the drift.
Preview is calculated right after any parameter change.
Calculates the analysis and shows the result on one frame.
Tip
When zooming in the molecule image, use  View > Visualization Controls > Preview
  to see the position of the currently observed area.
 Process All Frames
 Performs the analysis on all frames and shows the result. The following progress window appears.
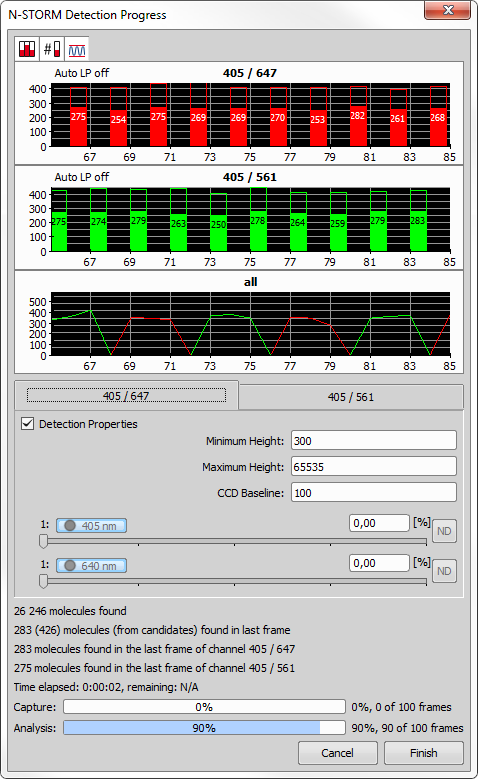
Figure 1418. Detection Progress window
 Display peak candidates
 Displays the “peak candidates” - peaks detected in the image, which were evaluated as invalid (not being molecules).
 Display peak values (if possible) in graphs
 Shows the number of detected molecules in each vertical bar. The number is shown only if it fits inside the bar.
 Keep auto Zoom
 Turns on the Y axis auto range so that the graph shows data in the optimal scale. If the auto zoom is turned off, the Y axis can be zoomed.
Note
Point the mouse over the black area of the graph and use the mouse wheel to zoom in/out. Place the cursor over the X or Y axis numbers and use the mouse wheel to zoom the specific axis separately. If multiple bar charts are shown in the Detection Progress window, their X axis zoom is automatically synchronized.
Displays the main molecule detection properties (described above).
Adjusts power of the connected lasers during the acquisition process.
Immediately stops the detection process and discards all analysed data.
Finishes the detection process without analysing all frames.
Table tab
This table displays each molecule and its measured features as a row record. Clicking on a row record highlights the selected molecule in the image. If the molecules are grouped by a selected feature (context menu over the column caption > Group By), each row represents the group which can be expanded using the arrow button. If filtering is applied, only the filtered molecules are shown in the image and table. An information text “Molecules total / image” is shown at the bottom of the dialog window.
Enabled filters - filters created directly in this definition area. Click
 <select> to set a feature for filtering, choose the AND/OR condition and set the Comparison mode and enter a custom value.
Disabled filters - filter defined in the Molecule Options dialog window (
View > Visualization Controls > Molecule Options  ). The filter is automatically added based on the currently viewed data.
 Show statistics
 Displays an additional table where overall column statistics are displayed.
 Use Filter
 Activate this button to filter the results.
 Define Filter
 This button displays a table where the filters are defined and shown. Two types of filters can be seen in this filter definition.

 Up/Down
 Moves the selected filter up/down.
Remove Removes the selected filter(s).
 Data to Excel,
  Data to Clipboard
 Exports all the data to MS Excel or Clipboard.

 Expand/Collapse All
 Expands/collapses the group data.
 SimpleExport,
  AdvancedExport
 Simple Export directly exports all the data to a .txt file while the Advanced Export selects which features are exported.
 Use data from entire image
 Data are shown from the entire image.
 Use data from probe
 Data are shown only from inside the probe.
 Use data from ROIs
 Data are shown only from inside the ROIs.
 Create molecules snapshot
 Creates a new image containing just the viewed molecules without a background. Any defined filters are taken into account.
Note
To render a snapshot of the currently viewed molecules with a high magnification, use Edit > Create View Snapshot in Rectangle (8bit RGB).
 Create View Snapshot from Molecules
 Render Volume
 To visualize the molecule clumps it is possible to create 3D binary shapes bringing a better idea of the sample structure. This button opens the Render Volume Settings dialog window which sets the parameters of the 3D binary. Image Width and Image Height define the dimensions of the 3D area. Calibration is calculated accordingly. Set either the Z Slices or the Z Step and set the Radius defining the size of the binary sphere around each molecule.
 Multimodal Image Registration
 Opens the Image > Channel Alignment and Registration > Multimodal Image Registration.
 Show/Hide Columns
 Opens the Select items to proceed dialog window where the user can select which measured features will be shown in the molecule Table. The user can also hide a feature by revealing the context menu over the column header and selecting Hide Column. All hidden columns can then be shown again by selecting Show All Columns.
This drop-down menu sets the statistics shown for the grouped data.
Graph tab
This tab visualizes the table data as a graph. In the drop-down menu select the graph type, set the feature on the X axis and Y axis or Bin counts and click  to generate the graph.
ROI Statistics tab
This tab is shown only if ROI(s) are present in the current image with molecules inside the ROI(s). It provides useful information regarding molecules within the ROI(s). For more information please see ROI Statistics .
Molecule Analysis
This tab offers several methods used for analysing the previously localized molecules.
Opens the Pick and define molecule analysis window used for selecting the molecule analysis method and output features which will be calculated and showed in the Filters table inside the View > Visualization Controls > Molecule Options dialog window.
Average distance of the nearest molecules is calculated and assigned to each molecule. The number of the nearest molecules is determined by the Count parameter.
Number of molecules present in the circle around each molecule is calculated and assigned. Define the size of the circle using the Radius parameter.
Using the Density-based spatial clustering of applications with noise clustering algorithm, ID and Size is assigned to each molecule in the cluster. Use the Radius and Minimum count parameters to adjust the clusters.
Creates clusters from the molecules present in the current image with the specified Maximum distance between the adjacent molecules and the specified minimum number of molecules (Minimum molecules) in the emerging cluster. A unique ID (Clusters) is given to each cluster.
If multiple molecules create a trace (see ![]() Show Traces in the View > Visualization Controls > Molecule Options ), this method calculates the Distance, Speed and Acceleration of the molecules in their track.
Show Traces in the View > Visualization Controls > Molecule Options ), this method calculates the Distance, Speed and Acceleration of the molecules in their track.
Check to see the effect of the settings directly in the image on the Probe which is automatically turned on and can be moved and resized. If both the probe and ROI is used in the image, specify in the drop-down menu on which of them the preview is shown. To recalculate the preview click  . To confirm the selected method click .
Removes the selected method from the list.
Edits the selected method.
For more information, please see N-STORM Acquisition and Analysis.