
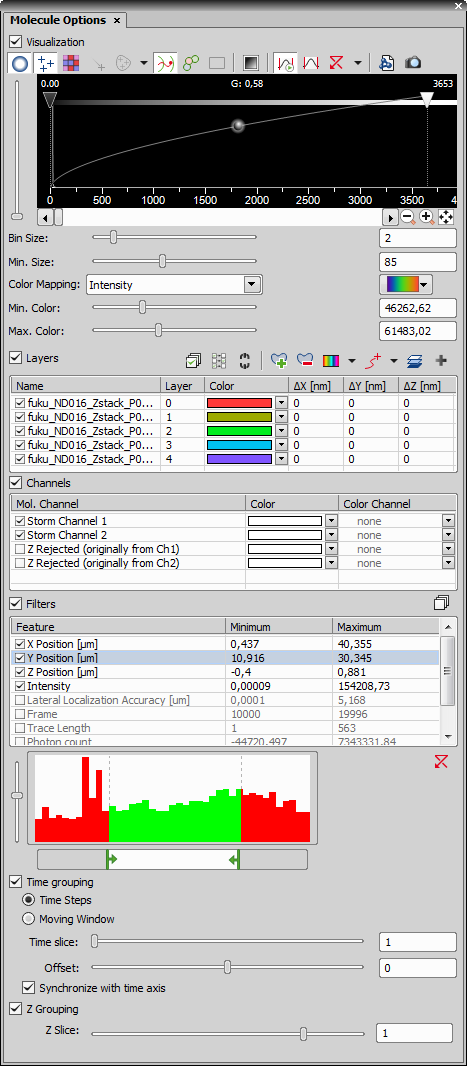
Figure 1414. Molecules Options dialog window.
This dialog window is used for visualizing molecule images (ND2 files containing the molecule data format). This window can also be opened from the image window after clicking the  View Molecules button.
Visualization
This section groups all tools used for visualizing the molecules.
 Normalized Gaussian Rendering
 Displays single molecules as circles. Adjust the circles visibility using the LUT control below or by the Auto Scale buttons.
 Render as Crosses
 Shows single molecules as crosses.
 Render Density Map
 Displays the molecule data where intensity of each screen pixel is the number of molecules that fall into that pixel. The pixel area can be adjusted using the Bin Size slider.
 Show Traces
 Displays traces of all moving molecules. Time dimension is required.
 Render Clusters
 Molecule clouds (clusters) are displayed in color. Opacity of all clusters can be set in Cluster Opacity... found in the drop down menu next to this button.
 Drift Correction
 Captured sample may sometimes slightly move in one direction (e.g. due to temperature). Turn on this function to fix this drift.
 Chromatic aberration correction
 Corrects the chromatic aberration issue.
 Mark molecules identified in current frame
 If source image data exist in the current molecule image, this function visualizes on which frame each molecule was localized.
 Black and White Overlay
 Color channels are mixed to form a black and white image suitable for better molecule visualization.
 Keep Auto Scale
 This function applies the auto scale procedure continuously when you move through the time dimension.
 Auto Scale
 This function adjusts the slider positions of all channels in the LUT control automatically with the purpose to reasonably enhance the image.
 Reset LUTs
 This function discards all LUTs settings. Click  next to the icon to reveal more LUT options. Change Photons per Count is used for entering a known value of photons that actually fell on the camera sensor.
 Extract Molecules from document
 Creates a new image with the settings currently set in the Molecule Options dialog.
 Create View Snapshot from Molecules
 Opens the Create View Snapshot from Molecules dialog window. For more information please see Create raster document from molecules.
Changes the minimal size of the molecule circle (available only in the Normalized Gaussian Rendering mode).
Changes the size of the pixel area of the density map.
Channel Color mode colors the molecules in their appropriate layer using the colors defined in the Color column.
Intensity mode colors the molecules using the selected pseudo-color gradient based on their pixel intensity.
Lateral Localization Accuracy mode colors the molecules using the selected pseudo-color gradient based on their detection precision. Adjust the minimal and maximal accuracy threshold using the sliders.
Depth mode colors the molecules based on their Z position calculated by the Z calibration. Adjust the minimal and maximal depth threshold using the sliders or use the  button to set the min/max values values from the Z calibration.
Frame mode colors the molecules using the selected pseudo-color gradient based on their detection in time.
Tip
To create a custom pseudo gradient, choose Manage Custom LUTs ( View > Image > LUTs > Create Custom LUTs).
Defines the minimal value (left side of the gradient) from which the colors start being applied.
Defines the maximal value (right side of the gradient) to which the colors are applied.
Layers
The molecule detection can produce many molecule layers. This table section controls and manages all layers in the image. For more information please see Z-Stacked STORM.
Channels
Z position of the molecules is outside the Z calibration range. Typically, a STORM system is calibrated within +/- 400 nm of the focal plane.
Z position of the molecules cannot be determined (based on its Wx and Wy properties) because the (Wx,Wy) point is too far away from the calculated Wy = f(Wx) calibration curve.
A set of molecules that are categorized into a predefined class in the final N-STORM Image. These are molecules that were not first identified in the imaging frame immediately following Activation.
A class of molecules that are categorized in a pre-defined channel in the final N-STORM Image. Z Rejected molecules only apply to 3D STORM datasets. Molecules are placed into the Z Rejected Channel for one of the two reasons:
Filters
This section defines filters and grouping.
Name of the detected molecule feature.
Minimal value of the selected feature which will be shown in the image. Use the histogram below to find the desired values.
Maximal value of the selected feature which will be shown in the image. Use the histogram below to find the desired values.
Move the green arrows of the histogram to change the minimum and maximum molecule feature values.
Resets any filters (minimum and maximum changes) and turns all filter features off.
Groups the time dimension and displays the grouping in a new “F” dimension.
Cumulates the time dimension into equivalent segments (“timelapses”) with their length specified in the Time slice edit box.

Figure 1415. F (2/10) grouping frames 11-20.
Highlights the cumulated time frames with a green color.

Figure 1416. F (26/100) grouping frames 24-33 with an offset value of 2 (2 frames before and 8 frames after).
Specifies the number of frames in a grouping segment. Its length is specified in the Time slice edit box.
Defines the frame offset inside a grouping segment (see image above).
If this function is turned on, frame dimension is synchronized with the time dimension showing molecules belonging to the particular frame. Move through “T” and “F” moves along.
Specifies the number of Z planes in a grouping segment.
For more information, please see N-STORM Acquisition and Analysis.