
Opens the Measurement Explorer organizing the previously defined measurement sequences (see  View > Analysis Controls > Measurement Sequencer - Definition
  ). The explorer list shows the measurement sequence definitions in bold and the finished measurements under each definition (click on the drop-down arrow). The last used definitions (either edited or executed) are listed at the top.
Double-clicking on the measurement definition opens the definition in the Measurement Sequencer - Definition panel. Double-clicking on the measurement result opens the result in the Measurement Sequencer - Run panel and opens the measured image (if available).
Multiple items can be selected inside the Measurement Explorer. For example, two and more measurement results can be selected (using Ctrl) and exported to the report (using the context menu) one after another. Similarly, multiple definitions can be selected and exported, duplicated or removed from the list at once.
User Input Required in the context menu over the measurement definition opens an input dialog box after each finished measurement so that the user can enter the sample name. This name can be later used to filter the results.
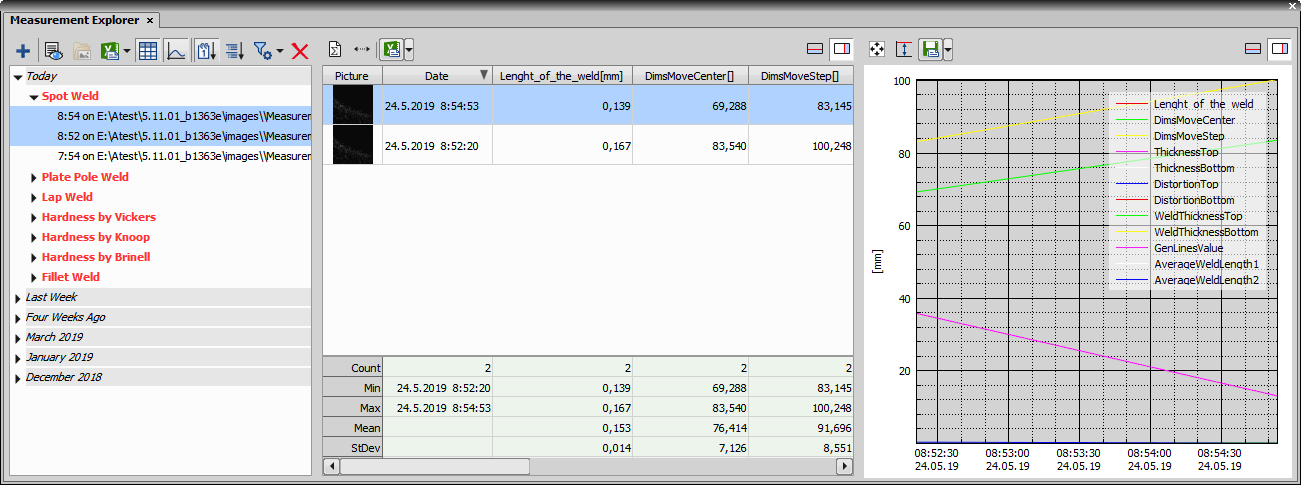
Figure 422. Measurement Explorer
 Create New
 Opens a drop-down menu where the user can select which type of new measurement will be created. The first one - Measurement Sequencer opens the Measurement Sequencer - Definition window used for creating a new sequence definition (see Measurement Sequencer - Definition).The other options utilize the Layer Thickness Measurement dialog (Layer Thickness Measurement). To rename a definition in the Measurement Explorer, use the context menu over the definition name.
 Run
Run The selected measurement sequence is opened in the Measurement Sequencer - Run (Measurement Sequencer - Run) panel where it can be executed.
 Edit
Edit Opens the selected measurement sequence for editing in the Measurement Sequencer - Definition (Measurement Sequencer - Definition).
 Open Result
 Opens the image on which the selected measurement was performed and shows the measurement directly inside the image.
 Open Document
 Export to Report, Export to Excel, Export to File, Export to Clipboard
 Exports the measurement data into a Report, Excel, File or Clipboard. Click on the black arrow next to the button to select the exporting method. Then click on the button itself to execute the selected export.
When exporting using the Export to Report method, a new window opens showing the report which can be printed or saved as a .pdf or .html file. Report can also be created by clicking on the measurement name in the list and selecting Generate Report in the context menu.
To export measurements into a .csv file, select Choose File..., navigate to a place where the file will be saved, name it (File name), click , select Export to File from the drop-down menu and click on the Export to File button to execute the export.
 Show Data
 Show Graph
 Displays a time chart summarizing the currently selected measurement. By holding down Ctrl and moving the mouse wheel zooms the x axis, while holding down Shift and moving the mouse wheel zooms the y axis.
 Show Groups
 The drop-down arrow next to this button is used to create group(s) and assign any measurement sequence definition(s) into the selected group. The button itself turns on/off the group view. All definitions not assigned to a group are shown in the <ungrouped> group.
Start by clicking  Create Group and name the group (repeat this for multiple groups). Then reveal the context menu over selected definition(s) and click
  Assign to Group and choose a group where it will be placed. To remove a definition from a group, choose
  Remove from Group. To delete a group without affecting the definitions inside, click
  Cancel Group. To change the order of multiple groups, click
  Reorder Groups and use the
 arrows to move the selected group up or down and then click . To rename a group use
  Rename Group.
 Sort by Date
 Sort by Type
 Date Filter
 Turns the date filter on/off. To set the date filter, click on the black arrow next to the icon and specify the filtering interval in the left and right calendar ( ).
).
 Configuration...
 Opens the Location dialog window where a new database can be created, copied or located. Also path where the data are stored can be adjusted.
 Import/Export from File
 Imports/exports the measurement definition(s) or the settings (current explorer settings with all its definitions) from/to a file. Select the importing/exporting option from the drop-down menu.
 Remove
 Deletes the selected measurement sequence definition with all of its results or the selected measurement.
 Show Statistics
 Resize Columns to Content
 Resizes each column of the table so that it fits the content inside of it.
 Graph Settings
 Reset Zoom
 Auto Scale
 Export Options
Weld Presets
If the Weld templates check box was selected during NIS-Elements installation, blue weld presets will be present in the list. These presets represent typical measurement use-cases for different types of welds and for hardness measurement (Vickers, Knoop, Brinell). Blue presets cannot be edited or deleted but it is possible to edit their duplicated copy (use the context menu on the weld name).
Each definition contains a chain of measurement tools arranged to measure the weld “fuse leg” parameter. Fuse leg is calculated as a percentage (fraction) of the measured distances and can be changed in the  Custom Expression. See the table below showing where to change the calculation defining the fuse leg position for each fillet (5; 0.2; 10; 10; respectively).
Table 10. Fuse leg calculation for the blue weld presets.
| Weld type | Calculation | Fuse leg percentage value |
|---|---|---|
| Spot | Math.min(ThicknessTop.result,ThicknessBottom.result)/5 | 20% |
| Plate Pole | T1.result*0.2 | 20% |
| Lap | T2.result/10 | 10% |
| Fillet | Math.min(T1.result,T2.result)/10 | 10% |