
To switch to the GPA application layout, click on in the NIS-Elements main toolbar.

Figure 330.
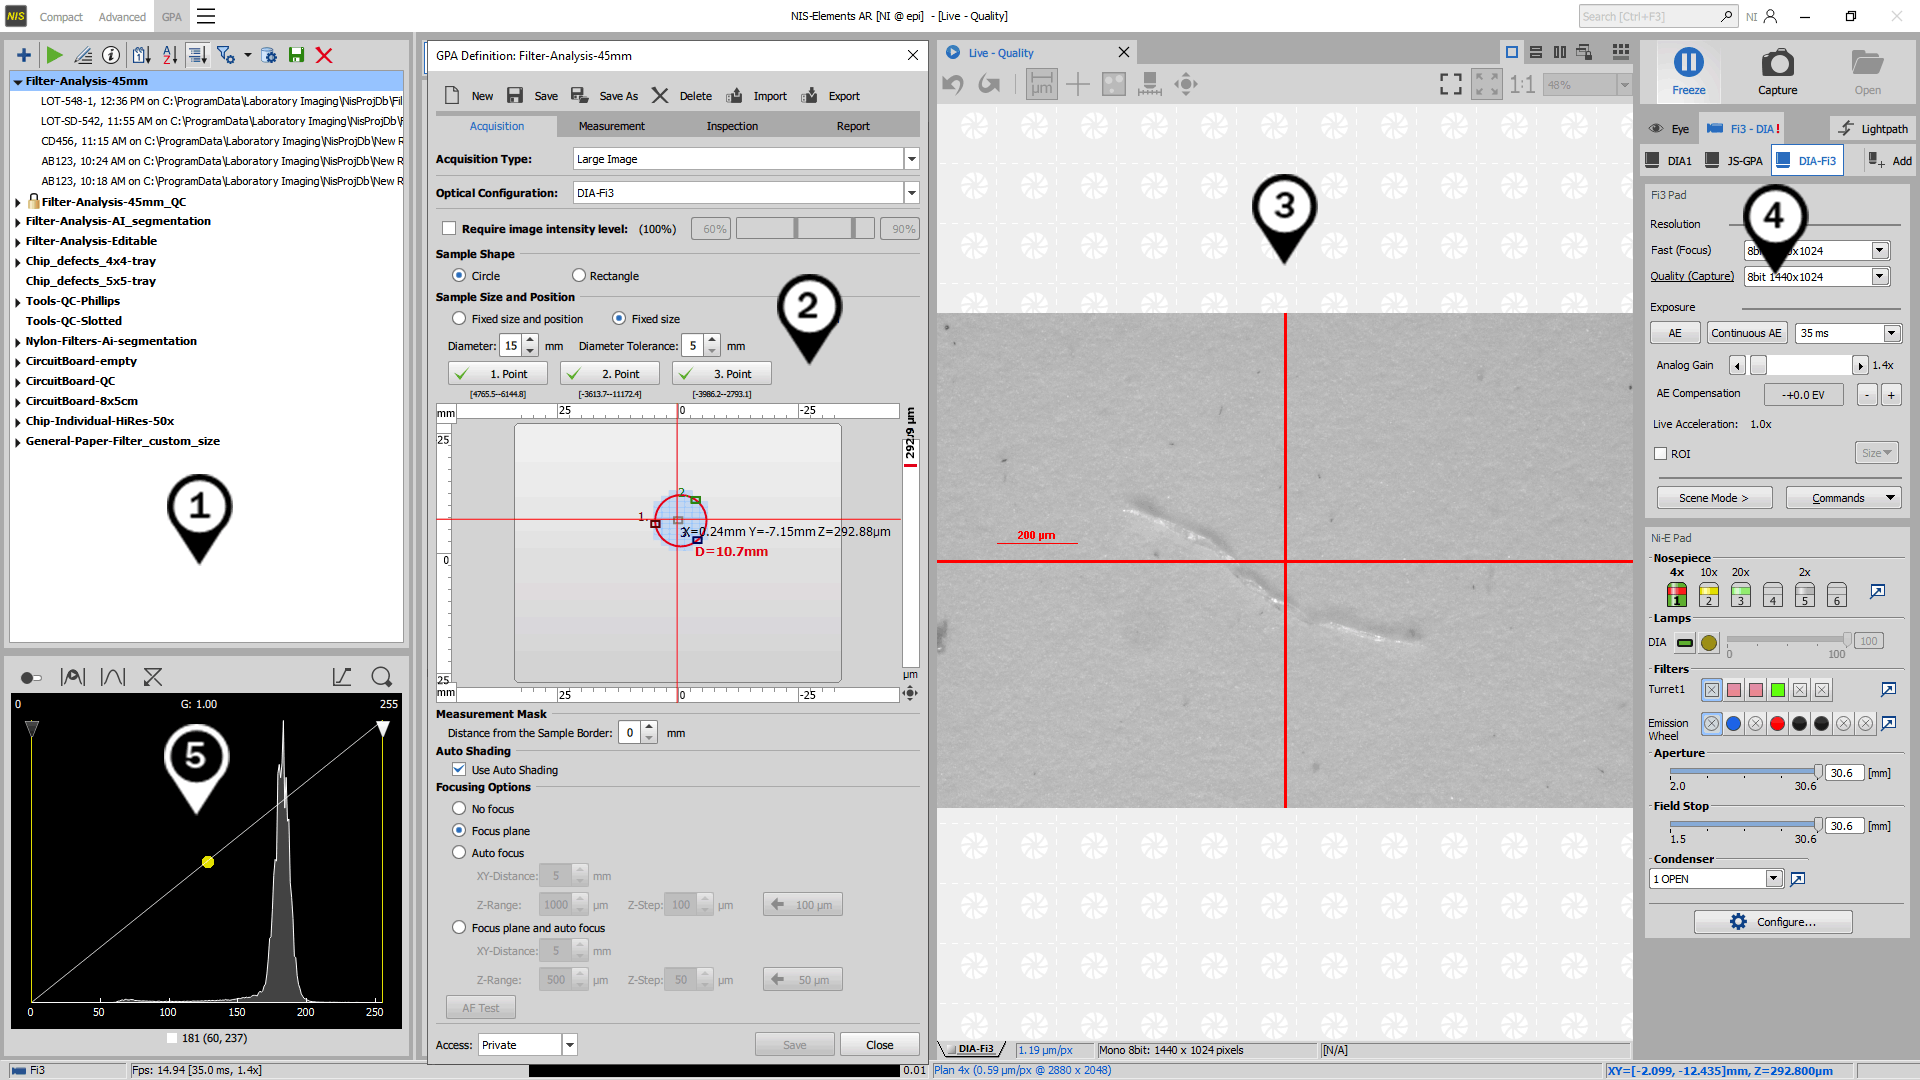
Figure 331. GPA application user interface.
Main GPA control panes
Acquisition, lightpath, camera and microscope control panels
To show or hide the GPA Explorer and Acquisition panel and to select a GPA recipe, use the top toolbar:

Figure 332. GPA top toolbar.