
Click
 Options in the left toolbar to display the Options dialog and select the Measurement tab.
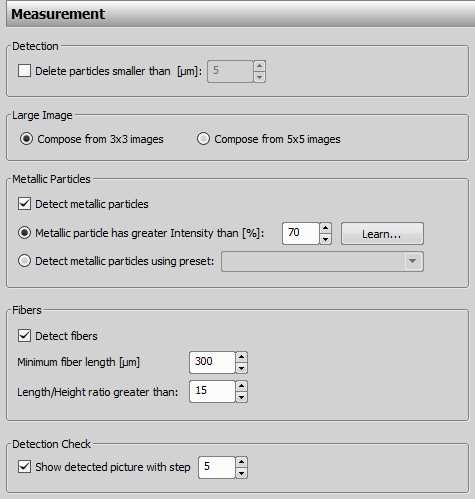
Figure 322. Measurement settings
Select which options you want to use during the measurement process.
Dialog Box Options
DetectionSelect the detection preset which is used for particle analysis in the Preset for detection combo box. You can find more details about this preset here: Defining Detection.
Delete particles smaller than option removes particles which do not fit to any of the size classes. This speeds up the detection process but all deleted particles will be omitted from the statistics.
Large Image“Large image” is created for each field in order to analyze the border-touching particles. Available sizes are 3x3 and 5x5 fields.
Metallic ParticlesIf you want to distinguish metallic particles among all the detected particles, check the Detect metallic particles option. Measured data will be displayed in the measurement statistics. Choose one of the two ways how to distinguish the particles:
Metallic particle has greater Intensity than [%]If you expect to see bright shining particles or particles with high contrast (mottled), check this option and fill in the MaxIntensity value. starts the Metallic Particles Detection window:
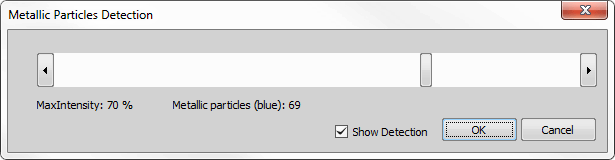
Figure 324.
The procedure should be done on an image which contains metallic particles. Use the arrows or move the slider to set the proper MaxIntensity value used for detection of metallic particles. Current value of the MaxIntensity feature is indicated below with information about the current number of detected metallic particles for selected MaxIntensity value - these are shown in the specified color directly in the image if the Show Detection option is on.
Detect metallic particles using presetCheck this option if you want to detect metallic particles using the selected detection preset. This detection should not be the same as the one selected in the Detection Control tab. For more information see: Defining Detection.
FibersCheck Detect Fibers if you want to detect and measure fibers. Measured data will be displayed in the measurement statistics. Only fibers with greater width/height ratio and/or more than a minimal length are detected.
Detection CheckBy default, no images are displayed during the analysis in order to speed it up. If you need to see the images being measured anyway, select the Show detected picture with step option and specify the step. Then, every N-th image will be displayed in an overlay with the detected particles.

The ISO 16232 standard specifies the way particles are analysed. A particle which takes place at the edge of the scanned field has to be measured as a whole, although it reaches the neighboring field. The application fulfills this requirement. Neighboring fields are connected to create one large image. The area measured at one time has the size of one scanned field and is marked with a measurement frame. The measurement frame ensures that all particles crossing its top and right border will be measured as a whole and the particles crossing its left and bottom border will not be measured at all (see the image below). A large image containing neighboring images is created for every measured field. In case the scanned field has no neighbor – e.g. a field placed at the edge of the filter – a plain white field is inserted automatically.
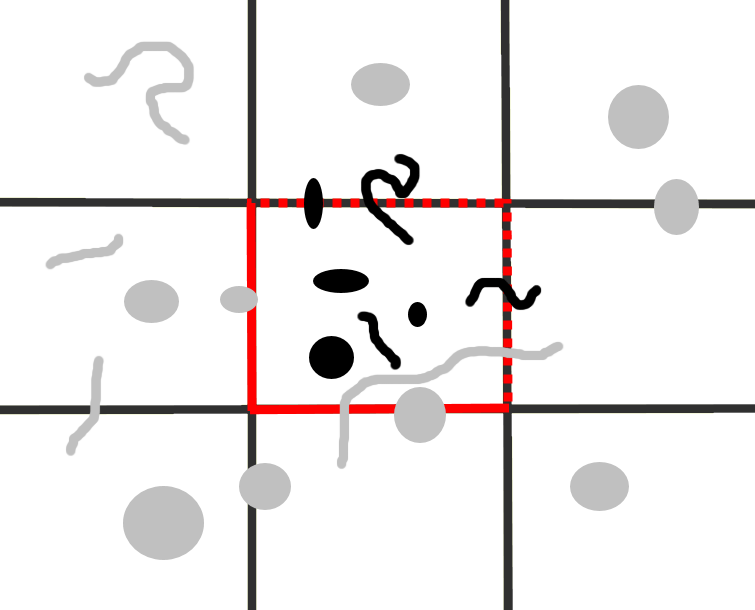
Figure 325. Analysis of filter particles
The rectangular grid represents image fields. The objects displayed in black will be analysed, the grey objects will be analysed as a part of another field. The measurement frame is highlighted red.