
In the report definition area, it is possible to create a new or customize an existing report so that all measurement results are exported with the same appearance. Use the  Edit Report button in the
  View > Analysis Controls > Measurement Sequencer - Definition
  panel to reveal the report definition area.
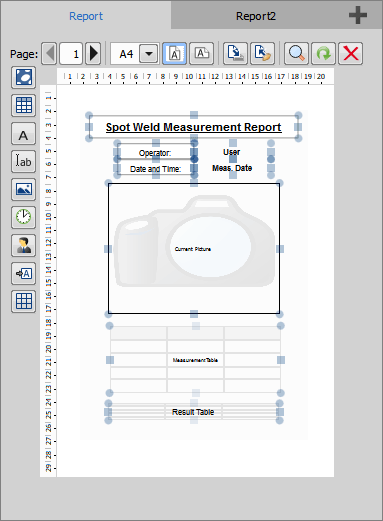
Figure 1344. Report definition area
Click or drag and drop the elements from the left side of the report area into the definition area and freely move or resize the items on the page. Open the  Edit Mode window to position the elements precisely with the help of the blue rectangles which snap together. To set the grid size to which the elements anchor, open the context menu over the white area and select the alignment size. Context menu over a placed element reveals further settings.
After a measurement sequence is run, button fills the resulting data into the defined report.
Report Editing Options

The add button in the top-right corner adds another PDF report template (described below) or  Excel template (see Excel Template). You can switch between the templates by clicking on the tabs. A template can be duplicated or removed in the context menu over the tab. Click
  Preview Report to view the template preview.
Selects the aspect of the report page layout. When the report is generated, a similar drop-down menu appears in the top toolbar enabling to choose the output page size. The report elements are automatically arranged to fit the selected output size.
 Portrait Orientation
 Landscape Orientation
 Save to File
 Load from File
 Load Default Report
 Clear Scheme
 Input Image
 Input Table
 Inserts a table which will be filled with measurement data. Right-click on the table and select whether measurements or results are shown. Adjust the text, border and fill in Properties and set the Header Properties.
 Input Graph
 This input feature is used in the General Analysis 3 application where the report node has to be connected to a graph output first. The connected graph is then visualized in the report. Supported node groups are: Graphs, Wellplate, Legacy Graphs, Legacy Ji Graphs.
 Input HTML
 This input feature is used only with the HTML Report node from General Analysis 3 utilizing the Nikon Ji Assay.
 Static Text
 Inserts a static text. Adjust the text, border and fill in the context menu (Properties).
 Edit Box
 Inserts a text box which can be filled with any text after the report is generated. Use Properties in the context menu for any visual adjustments.
 Picture from File
 Inserts a loading image. Use the secondary mouse click on the image, select Load... and choose an image which will be loaded.
 Date
Date Inserts a date or time. The time source, display format and text formatting is adjusted in the context menu over the element.
 Current User Reference
 Inserts the name of the current user. Adjust the text, border and fill in the context menu (Properties).
 Single Value
 Inserts a value selected from the context menu. Properties in the context menu adjust the text look.
 Sample ID
 Grid Layout